- Due Date: 3 February Reading: Chapters 1 & 2
Write a program that prints "Hello World" to the screen.
- Due Date: 6 February Reading: Chapter 4
Write a program that draws a hexagon.
Note: Choose a name for your file that is not turtle.py.
When executing the "import turtle" statement, the computer first looks in the folder where the file is saved for the turtle module and then in the libraries (and other places on the path). So, it thinks the module is itself, causing all kinds of errors. To avoid this, name your program something like "myTurtle.py" or "program2.py".
- Due Date: 7 February Reading: Chapters 1 & 2
Write a program that prints your name to the screen 20 times.
- Due Date: 8 February Reading: Chapter 4
Write a program that draws a octagon (8-sided polygon).
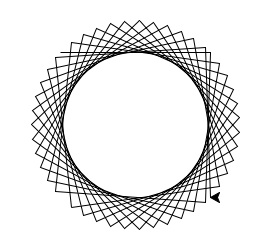
- Due Date: 9 February Reading: Chapter 4
Write a program that implements the
pseudocode ("informal high-level description of the operating principle of a computer program or other algorithm") below:
    Repeat 45 times:
        Walk forward 100 steps
        Turn right 92 degrees
Your output should look similar to:
- Due Date: 13 February Reading: Chapter 4
Write a program that draws a hexagon. Each side of the hexagon must be a different color.
- Due Date: 14 February Reading: Chapter 4
Write a program that will print out:
10
9
8
7
6
5
4
3
2
1
Blast off!
- Due Date: 15 February Reading: Chapter 4
Write a program that implements the pseudocode below:
    For i = 10, 20, 30,... ,200:
        Walk forward i steps
        Turn left 90 degrees
Your output should look similar to:

- Due Date: 16 February Reading: Chapter 4
The Turtle drawing library has a command that will control the width that's drawn to the screen. For example, if you turtle was named tony, the following command would set the pen to draw at size 10:
tony.pensize(10)
Write a program that implements the pseudocode below:
    For i = 10, 15, 20, 25, ..., 50:
        Change the pen size to i
        Walk forward i steps
        Turn left 50 degrees
Your output should look similar to:

- Due Date: 17 February Reading: Chapter 4 & 5
Write a program that makes a turtle walk 100 times. Each "walk" is 25 steps forward and the turtle can turn 0, 90, 180, or 270 degrees (chosen randomly) at the beginning of each walk.
Hint: See Lab 2.
- Due Date: 22 February Reading: Chapter 4
Write a program that prints out the numbers from 2000 to 2017 to the screen.
- Due Date: 23 February Reading: Chapter 4
Write a program that draws a colorful 5-pointed star to screen. Your program should prompt the user for the color that the star will drawn.
Hint: See Lab 3.
- Due Date: 24 February Reading: Chapter 2
Write a program that asks the user for their name and then writes their name to the screen 10 times.
- Due Date: 25 February Reading: Chapter 2
Write a program that implements the pseudocode below:
1.  Ask the user for the number of days until finals.
2.  Print out the weeks until finals (weeks = days // 7)
3.  Print out the leftover days (leftover = days % 7)
- Due Date: 27 February Reading: Chapter 4
Use turtle graphics to write your name to the screen, surrounded by a box or polygon. You may write your name in "cursive" by moving the turtle, or may use the write() command to have it printed to the graphics screen.
Hint: See Lab 3 for an example of the write() method for turtles.
- Due Date: 28 February Reading: Chapter 4
Using turtle graphics, draw a grid:
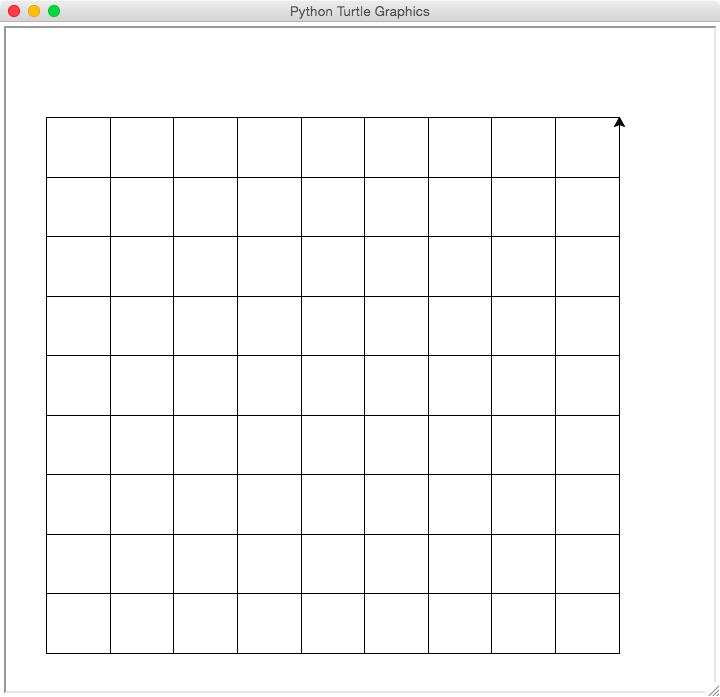
You may use any combination of turtle commands, but your image should have 9 by 9 grid shown above.
Hint: Resize the drawing canvas to give coordinates that are easier to use (see Lab 3).
- Due Date: 1 March Reading: Think CS Turtle Chapter
Write a program that asks the user for a message and draws it to the graphics screen using turtle's write() function.
Hint: See Lab 3 for an example of the write() method for turtles.
- Due Date: 2 March Reading: Chapters 9, 11
Write a program that takes a file of colors (one name per line) and draws a figure with each line drawn another color of the file. That is, the first line your turtle draws should be the first color in the file.
Hint: See Lab 4.
- Due Date: 3 March Reading: Chapters 9, 11
Write a program that takes the file where each line has two items, separated by a comma, and prints out the first item on each line to the screen. Assume that your file is called colorShape.
For example, if the contents of your file matched the one used in the lab, then your output should look like:
blue
red
purple
blue
red
Hint: See Lab 4.
- Due Date: 6 March Reading: Chapters 9, 11
Modify the first program in Lab 4. For your program, assume that each line of the file has a whole number, and use that to adjust the pen size of each line drawn.
For example, if the contents of your file is:
10
1
15
8
7
2
50
then your drawing would be:

Hint: You can convert a string to a number using int(c) and use that as the input parameter to pensize() (i.e. tortuga.pensize(int(c))).
- Due Date: 7 March Reading: Chapter 9
Write a program that prompts the user to enter a list of numbers. Each number is separated from the next by a comma (','). Your program should then print out the numbers, one per line.
Here is a sample interaction:
Please enter your list of numbers:  3, 1, 4, 5, 1, 9

You entered:

3
1
4
5
1
9

Thank you for using my program!
Hint: See Lab 5.
- Due Date: 8 March Reading: Chapter 9
Write a program that prompts the user to enter a list of names. Each person's name is separated from the next by a semi-colon (`;') and the names are entered lastName, firstName. Your program should then print out the names, one per line, with the first names first followed by the last names.
Here is a sample interaction:
Please enter your list of names:  Amadou, Zara; Burchman, Elaine; Fera, Joe; Owen, Megan; Schneiderman, Rob; St. John, Katherine

You entered:

Zara Amadou
Elaine Burchman
Joe Fera
Megan Owen
Rob Schneiderman
Katherine St. John

Thank you for using my name organizer!
Hint: Do this problem in parts: first, split the list by person (what should the delimiter be?). Then, split each of person's name into first and last name (what should the delimiter be here?).
- Due Date: 9 March Reading: Chapter 9
Write a program that asks the user for a string and then prints it out in all upper case and then all lower case.
Here is a sample run of the program:
Please enter a string:  Look behind, look here, look ahead
You entered (shouting):  LOOK BEHIND, LOOK HERE, LOOK AHEAD
But better (whispering): look behind, look here, look ahead
- Due Date: 10 March Reading: Chapter 9
Implement the following piece of pseudocode as a complete program:
    1.  Prompt the user to enter a string and call it s.
    2.  Let l be the length of s.
    3.  For i from 0 upto l-1:
    4.     print s[0:i]
    5.  For i from 0 upto l-1:
    6.     print s[i:l]
    5.  Print a closing statement
Here is a sample run of the program:
Enter string: a man a plan a canal panama

a
a
a m
a ma
a man
a man
a man a
a man a
a man a p
a man a pl
a man a pla
a man a plan
a man a plan
a man a plan a
a man a plan a
a man a plan a c
a man a plan a ca
a man a plan a can
a man a plan a cana
a man a plan a canal
a man a plan a canal
a man a plan a canal p
a man a plan a canal pa
a man a plan a canal pan
a man a plan a canal pana
a man a plan a canal panam
a man a plan a canal panama
 man a plan a canal panama
man a plan a canal panama
an a plan a canal panama
n a plan a canal panama
 a plan a canal panama
a plan a canal panama
 plan a canal panama
plan a canal panama
lan a canal panama
an a canal panama
n a canal panama
 a canal panama
a canal panama
 canal panama
canal panama
anal panama
nal panama
al panama
l panama
 panama
panama
anama
nama
ama
ma
a

Thank you for using my program!
- Due Date: 11 March Reading: Chapter 9
Write a program that prompts the user to enter 5 lines of text and then outputs the total number of characters that they entered.
Here is a sample interaction:
Enter line: Sing me no song, read me no rhyme
line character count is 33
Enter line: Don't waste my time, show me!
line character count is 29
Enter line: Don't talk of June, don't talk of fall
line character count is 38
Enter line: Don't talk at all!
line character count is 18
Enter line: Show me!
line character count is 8
The number of characters entered is: 126
- Due Date: 13 March Reading: Chapter 9
Write a program that asks the user to enter whole numbers, separated by spaces and
prints out the total of the numbers entered.
Here is a sample interaction:
Please enter your list of numbers:  3 1 4 5 1 9

Your total is 23
Hint: See Lab 5.
- Due Date: 15 March Reading: Chapters 9 & 11
Write a program that asks the user for the name of a file. You may assume that every line of the contains a single floating point number.
Your program should print out the sum of the numbers in the file.
For example, if your file contained:
8.0
-2.5
100.0
6.5
Then a sample run of your program would look like:
Please enter your file name:  nums.txt
The sum of your numbers is 112.0.
Hint: see Lab 5.
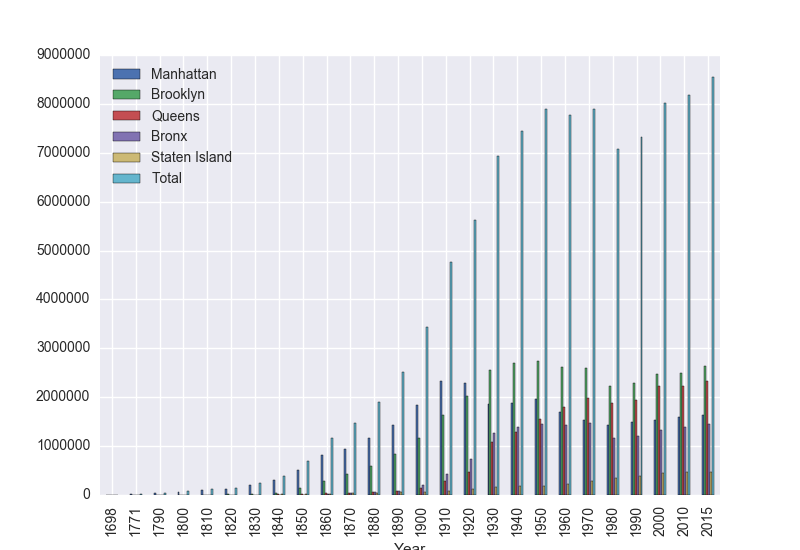
- Due Date: 16 March Reading: Chapter 9
Modify your program from Lab 6 that graphs historical NYC population data. Instead of plotting the data as a line graph, use the pandas plot.bar() function for creating bar charts:
- Due Date: 17 March Reading: Chapter 9
Modify your program from Lab 6 that graphs shelter census data. In addition to graphing the data, also print to the screen (Python shell), the minimum, average (mean), and maximum numbers of total individuals in the shelter.
- Due Date: 21 March Reading: Chapter 7
Write a program that asks the user for a whole number. If that number is even, your turtle should draw a blue line towards the left hand side of the screen. If that number is odd, your turtle should draw a red line towards the right hand side of the screen.
Hint: See Section 7.4 of the Python textbook.
- Due Date: 22 March Reading: Chapter 6
Lab 7 focuses on top-down design; that is, beginning with an outline for the main() and filling in the function definitions.
Fill in the missing function definitions for this program:
import turtle
def main():
	myWin = turtle.Screen()     		#The graphics window
	tristan = turtle.Turtle()		#Tristan will be our turtle for this program
	drawStem(tristan)			#Draw a green stem
	for i in range(20):
		drawPetal(tristan,"blue")	#Draws a blue petal for our flower
		drawPetal(tristan,"purple")	#Draws a purple petal for our flower
	myWin.exitonclick()         		#Close the window when clicked

main()
That is, write the functions drawStem() and drawPetal(). Include all functions, including the main() above in the file you submit.
Sample output of the program:

(Note: you can change the color that your turtle, using the function, color().
For example, if you turtle is called tess to change it's color in stringColor,
write tess.color(stringColor).)
- Due Date: 23 March Reading: Chapter 6
Complete the following program, which reads in a file that has multiple grades, each separated by a comma, and prints out the computed average. That is, write the functions getGrades() and calculateAverage():
def main():
      grades = getGrades()   #get the file name containing the grades
                             #and return the contents of the file
      avg = calculateAverage(grades) #separate the grades into numbers and compute
                             #the average
      print("The calculated average is:", avg)
main()
Hint: You may assume that there is one grade per line of the file. See Lab 7.
- Due Date: 24 March Reading: Chapter 7
The program turtleString.py takes a string as input and uses that string to control what the turtle draws on the screen (inspired by code.org's graph paper programming). Currently, the program processes the following commands:
- 'F': moves the turtle forward
- 'L': turns the turtle 90 degrees to the left
- 'R': turns the turtle 90 degrees to the right
- '^': lifts the pen
- 'v': lowers the pen
For example, if the user enters the string "FLFLFLFL^FFFvFLFLFLFL", the turtle would move forward and then turn left. It repeats this 4 times, drawing a square. Next, it lifts the pen and move forward 3, puts the pen back down and draw another square.
Modify this program to allow the user also to specify with the following symbols:
- 'B': moves the turtle backwards
- 'r': change the pen color to red
- 'g': change the pen color to green
- 'b': change the pen color to blue
Submit your modified program (including a comment at the top of the program with your name).
- Due Date: 27 March Reading: Chapter 7
Write a function that takes number between 1 and 12 as a parameter and returns the corresponding month as a string. For example, if the parameter is 1, your function should print out January. If the parameter is 2, your function should print out February, etc.
In your file, you should include a main() that allows the user to enter a number and calls your function to demonstrate that it works.
- Due Date: 29 March Reading: Chapter 7
Write a program that asks the user the number of times they plan to ride the subway or bus this week. Your program should then tell the user if it is cheaper to buy a regular fare (single ride) metro card or 7-day unlimited cards. (Note: the rates increased as of 15 March 2017).
First, compute the cost per ride for the 7-day unlimited metroCard ($31.00 divided by the number of rides) and for the regular fares with bonus. Next:
- Due Date: 30 March Reading: Chapter 5
Using folium (see Lab 8), create a map that will mark 5 cities. When you click on the marker for each city, it should pop-up the name of the city.
For this program, submit your .py program (not the .html file that it generates).
- Due Date: 3 April Reading: Chapter 5
Using folium (see Lab 8), create a map that shows all the traffic collisions on your birthday last year.
This assignment uses collision data collected and made publicly by
New York City Open Data, and can be found at:
https://data.cityofnewyork.us/Public-Safety/NYPD-Motor-Vehicle-Collisions/h9gi-nx95.
Download Collisions on your birthday: Using the "Filter" option, choose your birthday in 2016 and "Export" (in CSV format) all collisions for that day.
For this program, submit your .py program (not the .html file that it generates).
- Due Date: 4 April Reading: Chapter 5
Using folium (see Lab 8), create a map that shows all the traffic collisions in your favorite zipcode. For this map, mark all accidents involving a TAXI with a yellow icon. Note that either the vehicle type 1 or vehicle type 2 could be a taxi (i.e. you need to check for at least one of these being a taxi).
This assignment uses collision data collected and made publicly by
New York City Open Data, and can be found at:
https://data.cityofnewyork.us/Public-Safety/NYPD-Motor-Vehicle-Collisions/h9gi-nx95.
Download Collisions by zipcode: Using the "Filter" option, choose your zipcode and "Export" (in CSV format) all collisions for that day. If the file is too large to easily export, add an additional filter conditions that restricts the date is in 2016.
For this program, submit your .py program (not the .html file that it generates).
- Due Date: 5 April Reading: Chapter 5
Using pandas and folium (see Lab 8), make a map of all the museums in New York City. Your map should have a marker for each museum and include the name of the museum as a popup.
This assignment uses collision data collected and made publicly by
New York City Open Data, and can be found at:
https://data.cityofnewyork.us/Recreation/New-York-City-Museums/ekax-ky3z.
Download using the "Export" button (in CSV format).
For this program, submit your .py program (not the image that it generates).
Hint: You will need to use string methods to extract the latitude and longitude from the location data.
- Due Date: 7 April Reading: Chapter 5
In Lab 8, you created a github account. Submit the name of your account.
- Due Date: 19 April Reading: Chapter 8
The program errors2.py has lots of errors. Fix the errors and sumbit the modified program.
Hint: see end of Lab 9.
- Due Date: 20 April Reading: Chapter 7
Write a function that takes as two parameters: the zone and the ticket type, and returns the Copenhagen Transit fare.
- If the zone is 2 or smaller and the ticket type is "adult", the fare is 23.
- If the zone is 2 or smaller and the ticket type is "child", the fare is 11.5.
- If the zone is 3 and the ticket type is "adult", the fare is 34.5.
- If the zone is 3 or 4 and the ticket type is "child", the fare is 23.
- If the zone is 4 and the ticket type is "adult", the fare is 46.
- If the zone is greater than 4, return a negative number (since your calculator does not handle inputs that high).
You should include in the file a main() that calls your function several times to demonstrate that it works.
- Due Date: 24 April Reading: Chapter 7
Define a Python function named calculate_tax() which accepts one parameter, income, and returns the income tax. Income is taxed according to the following rule: the first $250,000 is taxed at 40% and any remaining income is taxed at 80%. For example, calculate_tax(100000) should return $100,000 * 0.40 = $40,000, while calculate_tax(300000) should return $250,000 * 0.40 + 50,000 * 0.80 = $140,000.
In your .py file, you should include a main() that calls your function several times to demonstrate that it works.
- Due Date: 26 April Reading: Chapter 8
Write a program that asks the user to enter a string. If the user enters an empty string, your program should continue prompting the user for a new string until they enter a non-empty string. Your program should then print out the string entered.
- Due Date: 27 April Reading: Chapter 8
Modify the tic-tac-toe program from Lab 9 to check that the user chooses an empty square. Your program should ask the user for coordinates of where to play. While their choice of square if filled, you should continue to ask them until they choose an empty square. When the choose an empty square, the program continues as before.
- Due Date: 1 May Reading: Intro to R
Write an R program that prints Hello World!. See Lab 10 for getting started with the R programming language.
- Due Date: 2 May Reading: Intro to R
Write an R program that will print your name to the console 20 times.
- Due Date: 3 May Reading: Intro to R
Write an R program that will print out:
10
9
8
7
6
5
4
3
2
1
Blast off!
- Due Date: 4 May Reading: Intro to R
Write an R program that prints out the numbers from 2000 to 2017 to the screen.
- Due Date: 5 May Reading: Intro to R
Write an R program that prints out the following pattern:
[1] 1
[1] 1 2
[1] 1 2 3
[1] 1 2 3 4
[1] 1 2 3 4 5
[1] 1 2 3 4 5 6
[1] 1 2 3 4 5 6 7
[1] 1 2 3 4 5 6 7 8
[1] 1 2 3 4 5 6 7 8 9
 [1]  1  2  3  4  5  6  7  8  9 10
 [1]  1  2  3  4  5  6  7  8  9 10 11
 [1]  1  2  3  4  5  6  7  8  9 10 11 12
 [1]  1  2  3  4  5  6  7  8  9 10 11 12 13
 [1]  1  2  3  4  5  6  7  8  9 10 11 12 13 14
 [1]  1  2  3  4  5  6  7  8  9 10 11 12 13 14 15
 [1]  1  2  3  4  5  6  7  8  9 10 11 12 13 14 15 16
 [1]  1  2  3  4  5  6  7  8  9 10 11 12 13 14 15 16 17
 [1]  1  2  3  4  5  6  7  8  9 10 11 12 13 14 15 16 17 18
 [1]  1  2  3  4  5  6  7  8  9 10 11 12 13 14 15 16 17 18 19
 [1]  1  2  3  4  5  6  7  8  9 10 11 12 13 14 15 16 17 18 19 20
(Hint: it can be done in 1 line of code! Think about what 1:i does...)
- Due Date: 8 May Reading: Intro to R
Write an R program that plots the Bronx population over time. Include in your graph a line representing the mean population over time. See
Lab 12 for details on plotting data frames and the historical population data set.
- Due Date: 9 May Reading: Intro to R
Rewrite your program from Lab 6 that graphs shelter census data in R. Your program should graph the data and also print to the screen (R shell), the minimum, average (mean), and maximum numbers of total individuals in the shelter.
- Due Date: 10 May DataCamp Summary Statistics Tutorial
In Lab 12, we used plot() to create scatter plots and compute summary statistics of our data.
Write a program that will plot the built-in data set cars (car speed and stopping distances recorded in the 1920s. Your plot should display:
- the speed versus the stopping distance
- the x-axis should be labeled: "Speed"
- the y-axis should be labeled: "Stopping Distance"
- the plot should be labeled: "Cars Data from 1920's"
(Hint: see the title() command), and
- display the average stopping value as an abline.
Note: while computing averages and adding ablines were covered in lecture and tutorials, the adding labels and titles were not. The purpose of this problem is for you to figure out how to add these using R's help system (i.e. help(plot) will give all the options for creating a plot-- read through the options and choose the appropriate ones).
- Due Date: 11 May DataCamp Intro Tutorial
In Lab 12, we used plot to create scatter plots. For example,
plot(quakes$long, quakes$lat)
will plot the built-in dataset of 1000 earthquakes near Fiji.
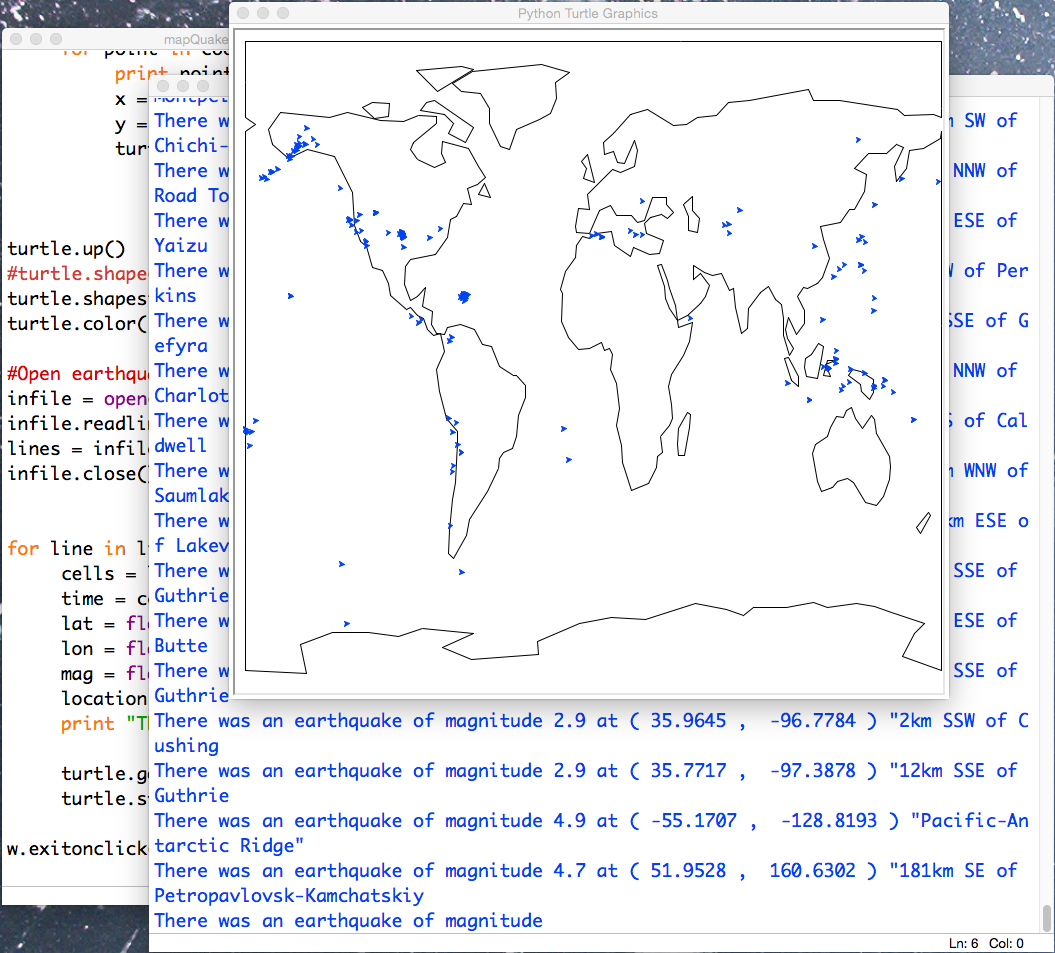
Write a program that will make a similar plot using the earthquake observation data collected by the US Geological Survey.
You can use this sample file (downloaded in January of quakes magnitude 4.5 or higher) or download current data. Your program will be quite short and should:
- Read in the CSV file to a data frame.
- Display a scatter plot of the longitude versus the latitude
of the earthquake observations in the file.
- Due Date: 12 May Harvard R Graphics Tutorial
The goal of the graphics tutorial in Lab 13
was to produce the following graph from The Economist:
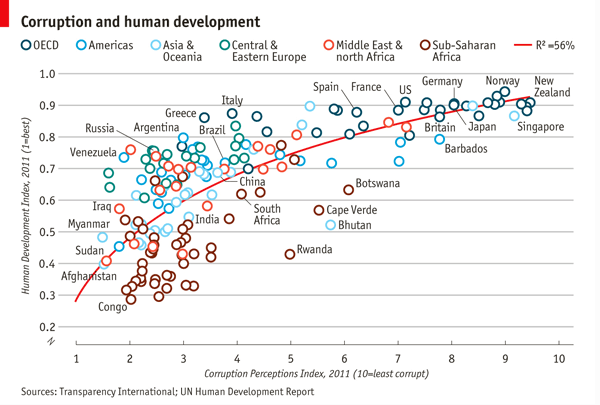
Submit your program that produces a graph that is as close as possible to the original graph.
- Due Date: 15 May DataCamp Correlation Tutorial
Cancelled due to issues with ggplot in the lab.
In the correlation tutorial in Lab 13, we used ggcorr to plot a color coded matrix labeled with the correlation coefficients of each variable to the other as well as scatter plots with linear regression lines.
Using the same movies data set, create a new variable of profitPerYear (that is, the amount of profit made divided by the duration of the film). Your final program should include:
- ggcorr plot, including the new variables profit and profitPerYear.
- a smoothed qplot of votes versus profitPerYear.
(Note: ggcorr() is not showing the graphics window, so, you can skip that part of the assignment).
- Due Date: 16 May DataCamp Intro Tutorial
Cancelled due to issues with ggplot in the lab.
Using the shelter census data from Lab 6 as well as the graphics tutorial in Lab 13 and
tidyverse help page on ggplot2, create the following plot.
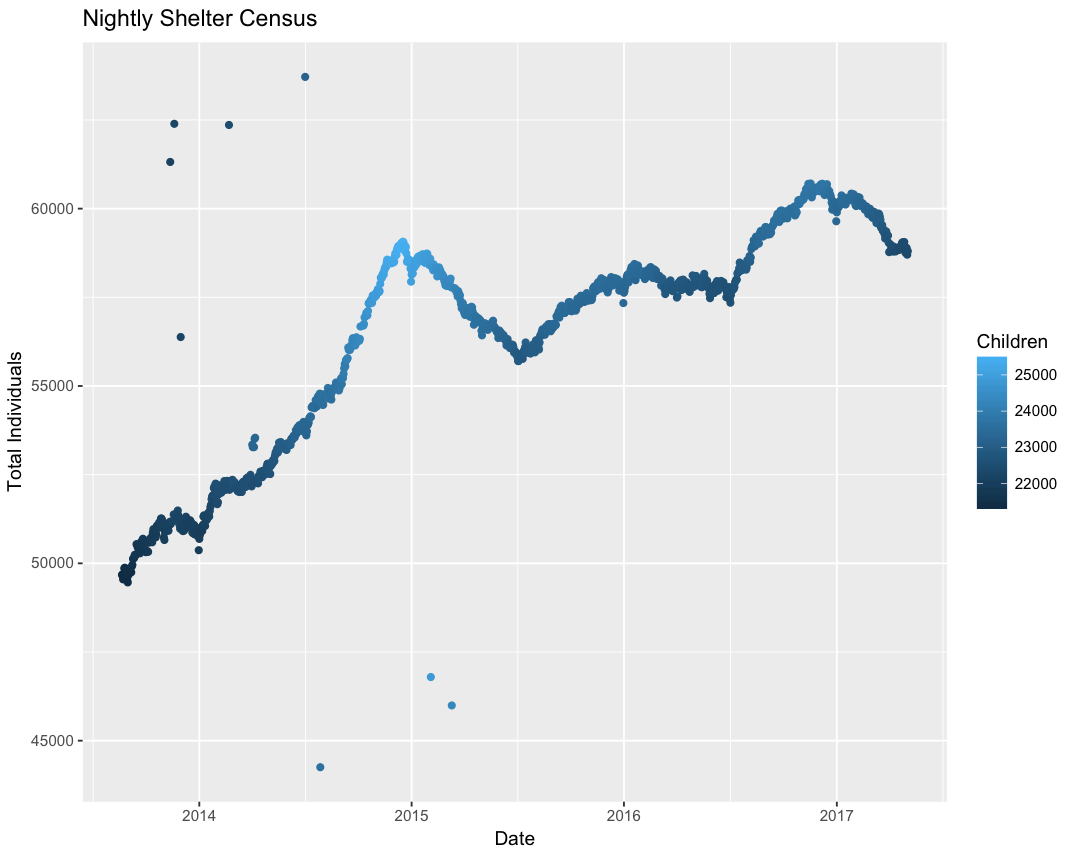
The plot shows the total number of individuals in the shelter over time. The curve is shaded by the number of children. Labels and titles should match the image.
Note: The city's choice of date formats is not one of the defaults for read_csv. If you read in your file to the data frame, dhs, you can fix the dates by specifying which subfield corresponds to month, day, and year by:
dhs$Date.of.Census <- as.Date(dhs$Date.of.Census, "%m/%d/%Y")
(where %m is month, %d is day, and %Y is the year as 4 digits).
- Due Date: 17 May DataCamp Intro Tutorial
Cancelled due to issues with ggplot in the lab.
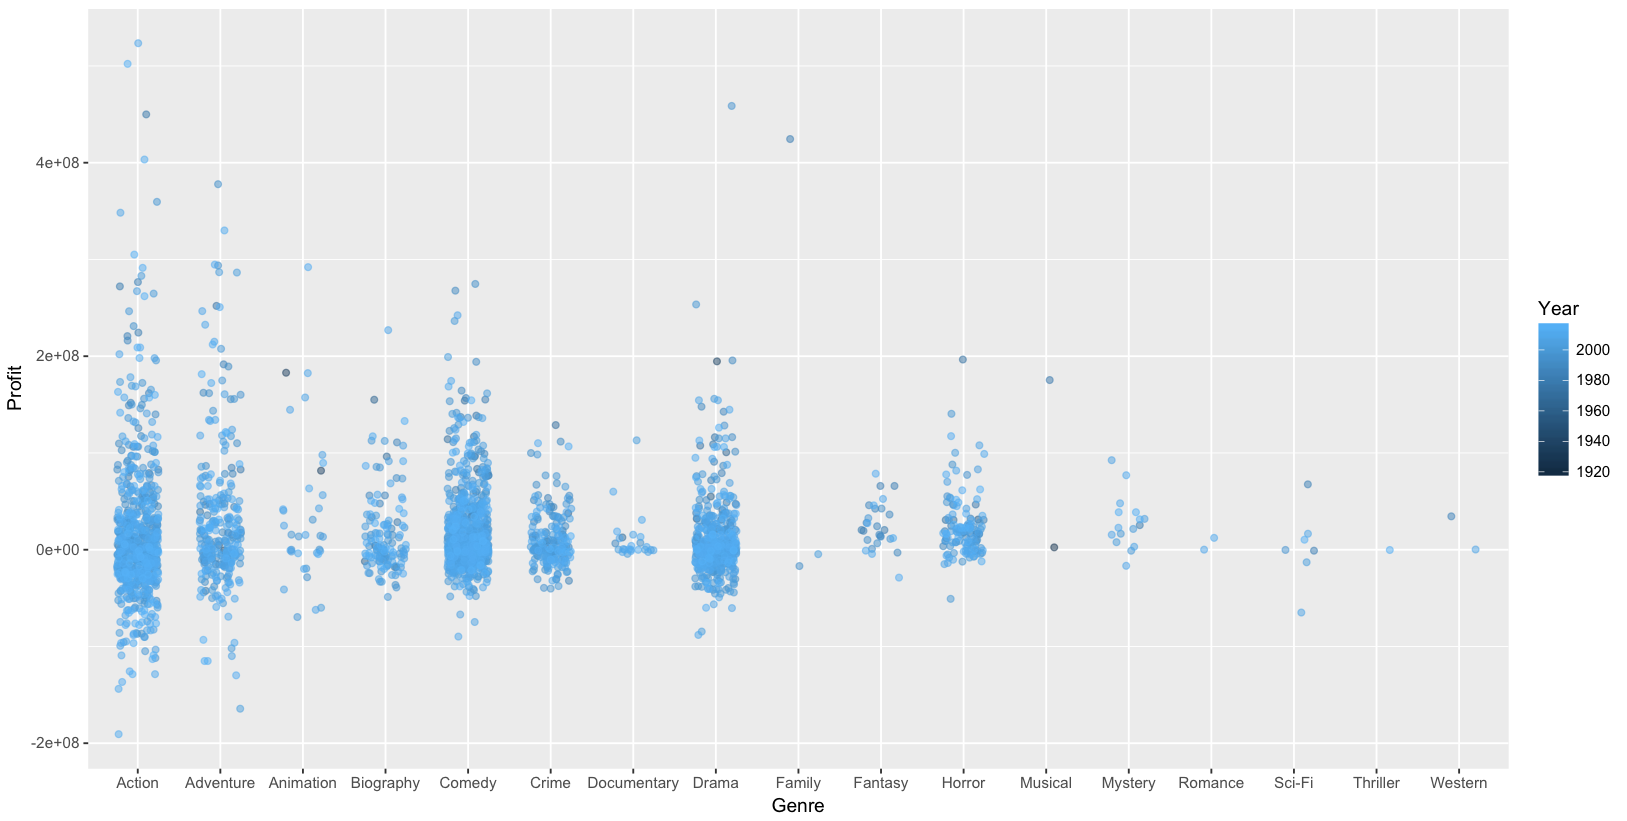
In Lab 13, we worked through two different tutorials. Use the movie data set from the first tutorial and the techniques from the second (scroll down to house values by state section) to create the analysis below of movie profits by genre and year:
- Due Date: 18 May DataCamp Intro Tutorial
Modify the first program in Probability Plots that shows the comparison of the Student t-distribution (generated with the dt) for different degrees of freedom. Change the program to
- It currently compares the Student T-distribution with degrees of freedom of 1, 3, 8, 30 with the normal distribution. Modify the program to compare 10 degrees of freedom. also (that is 1, 3, 8, 10, 30 with the normal distribution).
- Your new curve should be purple.
- Your labels and legend should include this additional curve.
(Hint: See Lab 14).
- Due Date: 19 May DataCamp Intro Tutorial
Write a program to compute the chi-squared test on the hypotheses that miles per gallon is independent of the other variables in the built-in data set, mtcars:
> str(mtcars)
'data.frame':	32 obs. of  11 variables:
 $ mpg : num  21 21 22.8 21.4 18.7 18.1 14.3 24.4 22.8 19.2 ...
 $ cyl : num  6 6 4 6 8 6 8 4 4 6 ...
 $ disp: num  160 160 108 258 360 ...
 $ hp  : num  110 110 93 110 175 105 245 62 95 123 ...
 $ drat: num  3.9 3.9 3.85 3.08 3.15 2.76 3.21 3.69 3.92 3.92 ...
 $ wt  : num  2.62 2.88 2.32 3.21 3.44 ...
 $ qsec: num  16.5 17 18.6 19.4 17 ...
 $ vs  : num  0 0 1 1 0 1 0 1 1 1 ...
 $ am  : num  1 1 1 0 0 0 0 0 0 0 ...
 $ gear: num  4 4 4 3 3 3 3 4 4 4 ...
 $ carb: num  4 4 1 1 2 1 4 2 2 4 ...
(Hint: See Lab 14).