Today's lab will focus on looping through data files to make maps.
Software tools needed: web browser and Python IDLE programming
environment.
World Maps
We can use the techniques from last lab to map and different scales. Let's start by mapping cities of the world.
Locations in the world are usually indicated by their latitude and longitude.
- Latitude measures the number of degrees north or south of the equator. When written as a number, it ranges from -90 (the south pole) to +90 (the north pole).
- Longitude measures the number of degrees east or west of the prime meridian. When written as a number, it ranges from -180 to +180.
We will use those ranges to be our coordinates: (-90, -180) to (90,180). Let's map some cities:
In the trinket below, map the following cities:
- New York City,
- Los Angeles,
- Paris, France,
- Tokyo, Japan,
- Sydney, Australia,
- Rio, Brazil, and
- Cairo, Egypt
Pandas & Folium
We introduced Pandas in Lab 6. We'll use here to read in large CSV files and then make maps of the GIS data inside it.
Folium is a Python package that uses the javascript Leaflet.js library to make beautiful interactive maps. Instead of popping up a matplotlib window, folium creates an .html file that you can open (and view interactively) with a browser. After the program runs, open the corresponding html file in a web browser to see your map.
Check to see if you have folium already:
import folium
If not, go to the terminal, and download it:
pip install folium
Our First Map
To make a map in folium, the process is:
- Write a program in Python, using folium.
- Run the program, which outputs an .html file.
- Open the .html file in a browser.
Here's our first program:
#Import the folium package for making maps
import folium
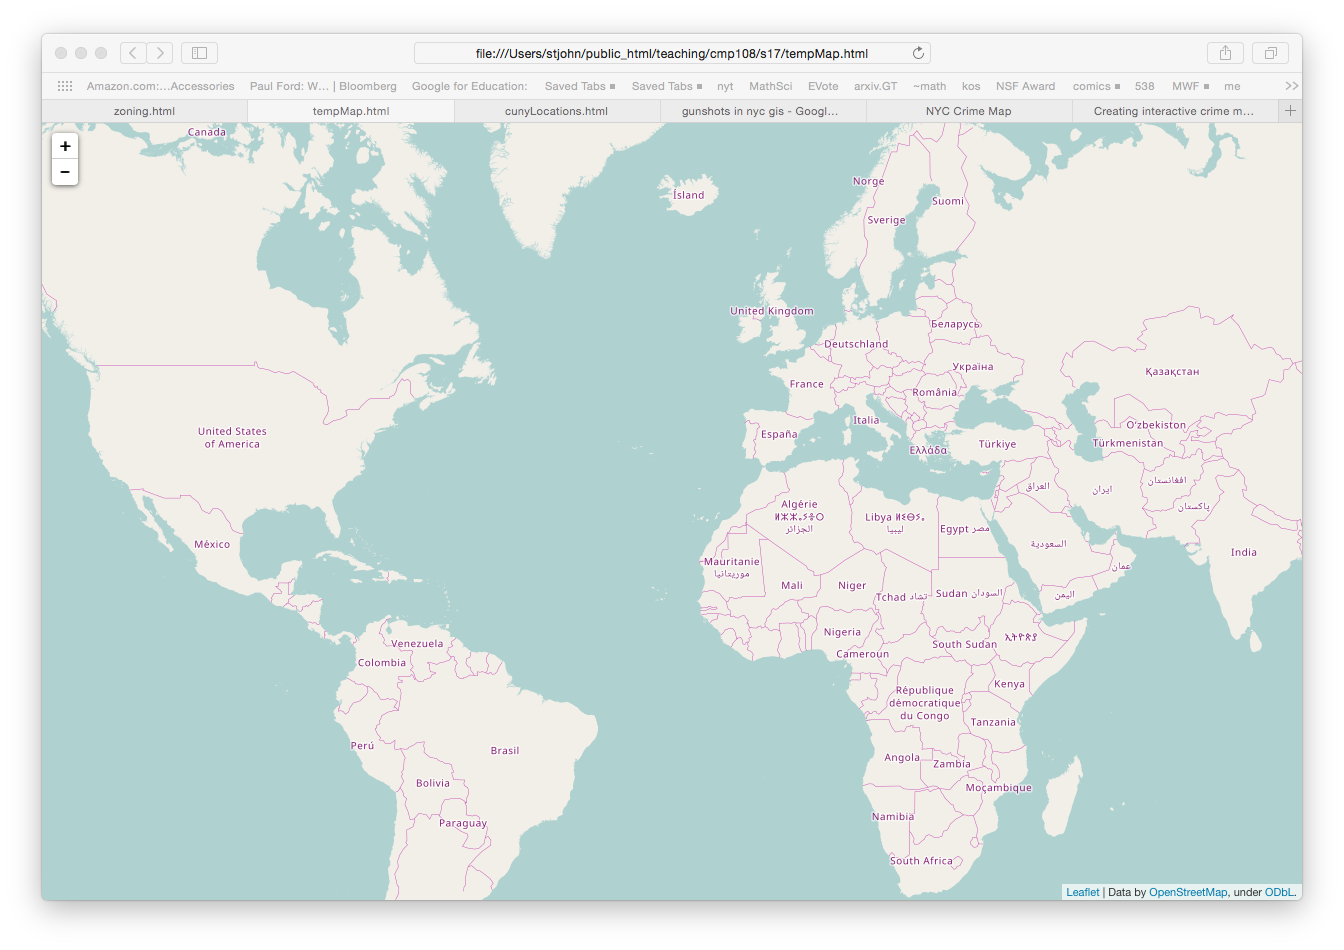
#Create a map, centered (0,0) and zoomed out a bit:
mapWorld = folium.Map(location=[0, 0],zoom_start=3)
#Save the map:
mapWorld.save(outfile='tempMap.html')
Save this file and run it. It will create a file called tempMap.html.
Open your favorite browser (Chrome, Firefox, IE, etc.) and choose "Open File" and then choose the file tempMap.html. You should see a map of the world.
Map of New York City
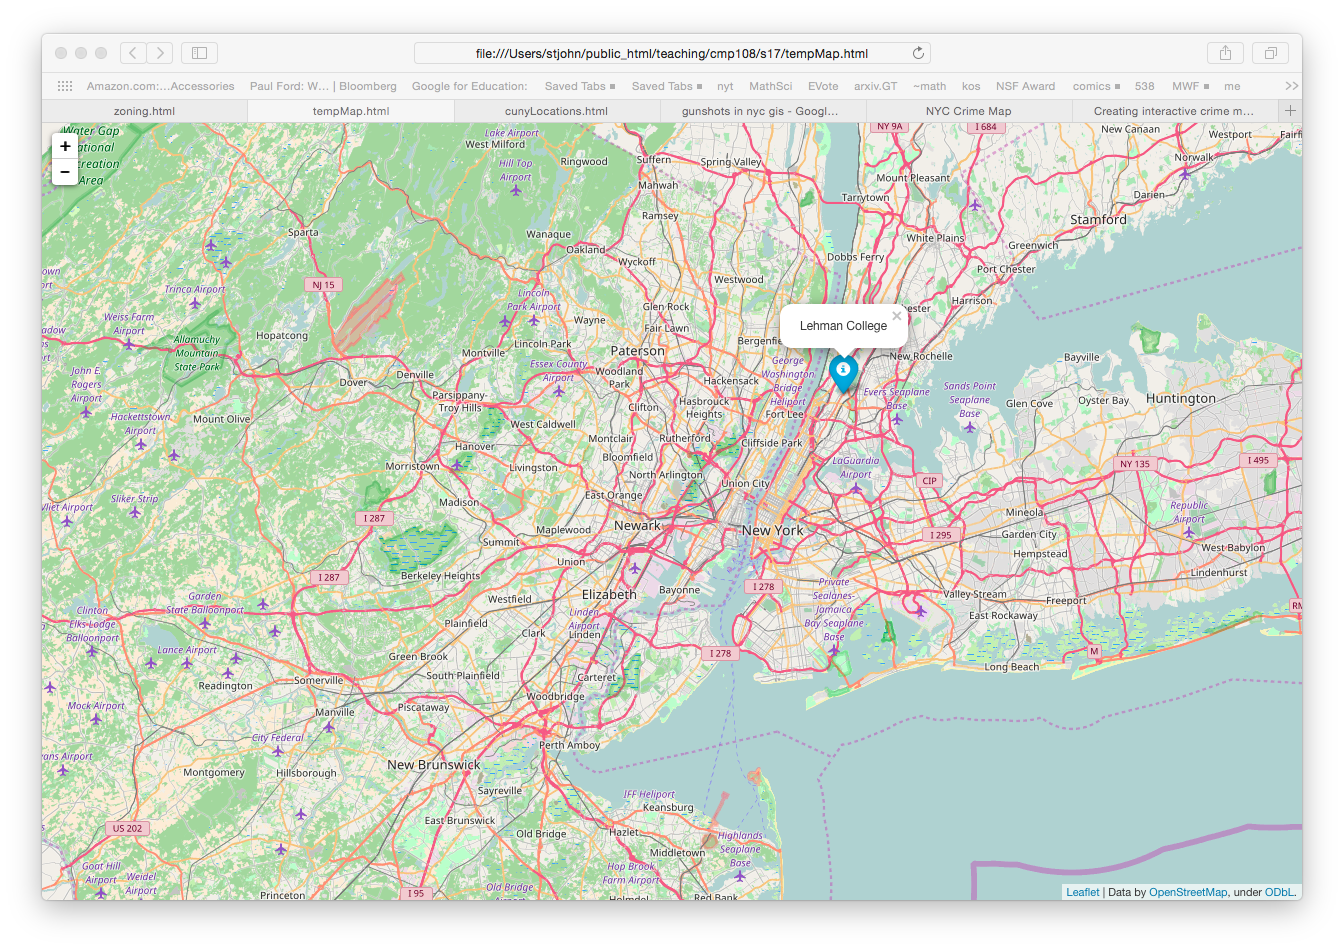
Let's make another map, focused on New York City. To do that, when we set up the map object, we need to reset the location to New York City and the increase the zoom level:
import folium

mapCUNY = folium.Map(location=[40.75, -74.125],zoom_start=10)
Let's add in a marker for Lehman College:
folium.Marker(location = [40.873442, -73.889361], popup = "Lehman College").add_to(mapCUNY)
and create the .html file:
mapCUNY.save(outfile='tempMap.html')
Plotting from Files
We can combine the mapping of folium with the tools we have used for CSV files.
Let's make an interactive map of the the CUNY campuses. Instead of typing every location in by hand, we can use a file. First, download a CSV file from data.ny.gov:
(Export as a
.csv file and save in the same directory as your programs.) Open the file to make sure you have all the lines (should be 23) and to check if the column headings occur in the first row (they do, so no need to skip rows when reading in the file).
Let's use Pandas to read in the file. We will need to import pandas and folium:
import folium
from folium.plugins import MarkerCluster
import pandas as pd
Note that we're explicitly importing MarkerCluster from the Folium plugins (we're going to use it to cluster markers together as the map zooms out).
To read in the CSV file, we'll use pandas' csv reader. We'll print out the campus locations to make sure that all were read in:
cuny = pd.read_csv('cunyLocations.csv')
print (cuny["Campus"])
Next, let's set up a map, centered on New York City:
mapCUNY = folium.Map(location=[40.75, -74.125])
We need to add markers for each campus. First, we'll create empty lists to hold the locations, the popup messages, and the icons:
#Create lists to hold coordinates and popups:
coords = []
popups = []
icons = []
We're going to iterate through the rows of dataframe to create the markers:
#For each row in the CSV file:
for index,row in cuny.iterrows():
    #Extract the data:
    lat = row["Latitude"]
    lon = row["Longitude"]
    name = row["Campus"]
    #Add the [lat,lon] to list of coordinates:
    coords.append([lat,lon])
    #Add the names to the popup list>
    popups.append(name)
    if row["College or Institution Type"] == "Senior Colleges":
        icons.append(folium.Icon(icon='cloud'))
    else:
        icons.append(folium.Icon(color='green'))
Note that we're putting in different icons, depending on whether its a senior college or not.
Once we have everything set up, let's add all the markers at once:
#Add all the markers at once:
mapCUNY.add_children(MarkerCluster(locations=coords, popups = popups, icons=icons))
Lastly, let's save our map:
mapCUNY.save(outfile='cunyLocations.html')
To view your map, open a browser. From the browser, open the file: cunyLocations.html.
github
github is the standard way to share and collaborate on code. It functions much as Google docs does for documents.
The first part of today's classwork is to get started on github:
- If you do not already have an account, create an account on github.
- Work through the github for beginners tutorial.
- Work through the
github Hello World tutorial.
- Submit your github username for Problem #1 on Homework #3. If you have more than one account, submit the username you plan to use for the programming and project for this course.
In-class Quiz
During lab, there is a quiz on functions. The password to access the quiz will be given during lab.
What's Next?
If you finish the lab early, now is a great time to get a head start on the programming problems due early next week. There's instructors to help you and you already have Python up and running. The Programming Problem List has problem descriptions, suggested reading, and due dates next to each problem.