Today's lab focuses on using statistical models and hypothesis testing in the R programming language.
Hypothesis Testing
Hypothesis testing is a central tool in data analysis, particularly in the social sciences.
If it's been a long time since you have seen hypothesis testing, Khan Academy has a very friendly introduction to significance tests of one sample. If you're in the lab, be kind to your neighbors, and watch with headphones (or turn off the sound and read the subtitles). We're going to compute the Z-statistics and T-statistics, which are in the section on "Tests about a population mean."
If the video is a bit long-winded, here's a more concise and formal description of
hypothesis testing in normally distributed data.
Distributions in R
There are a large number of probability distributions available in R, but we'll focus on 4 of them that occur often. Here is a reference to the commands for
distributions in R.
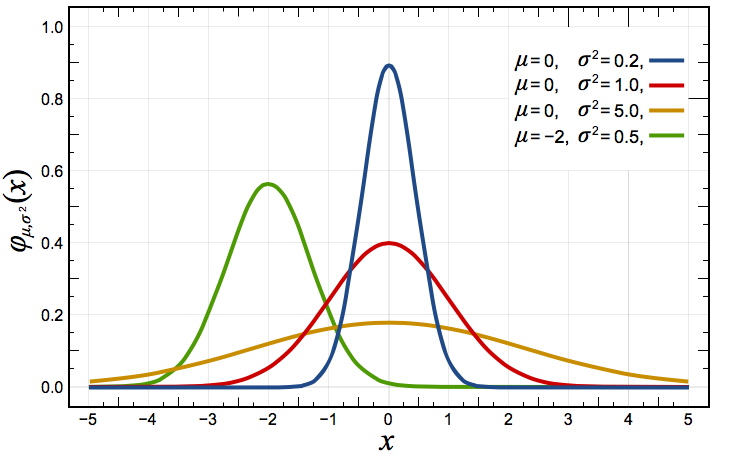
We discussed the normal distribution in class, shown here with different means (values for mu) and different variances (values for sigma^2):
Two commonly used distributions that approach the normal distribution are:
- Student's t-distribution: commonly used, in place of the normal distribution for small samples.
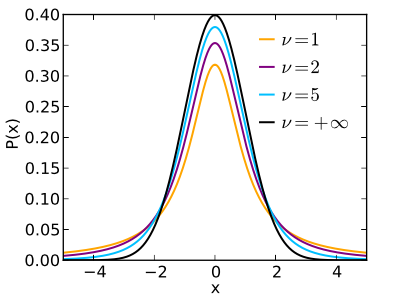
As v (degrees of freedom) gets large, the distribution approaches the normal distribution.
- Chi-Squared Distribution: used for chi-squared tests for goodness of fit.
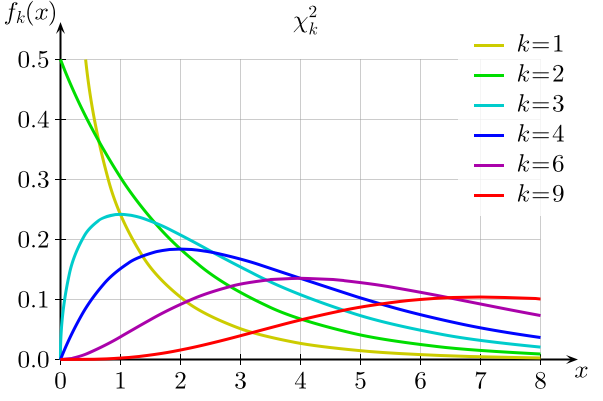
As k (degrees of freedom) gets large, the distribution approaches the normal distribution.
Let's look at an example. Try the first program in Probability Plots that shows the comparison of the Student t-distribution (generated with the dt) for different degrees of freedom. Change the program to
- It currently compares the Student T-distribution with degrees of freedom of 1, 3, 8, 30 with the normal distribution. Modify the program to compare 10 degrees of freedom. also (that is 1, 3, 8, 10, 30 with the normal distribution).
- Your new curve should be purple.
- Your labels and legend should include this additional curve.
Submit your modified program as
Program #59.
Common Tests
The t-test is used to determine whether the mean of two groups are equal to each other.
Start by working through UCB's notes on t-tests in R.
The chi-squared test is used, roughly, to test if one variable is affected or not by the presense of another. For example, in the built-in Motor Trends Cars data set, we can test if the displacement of the engines of the cars surveyed is independent of miles per gallon:
chisq.test(mtcars$disp, mtcars$mpg)
which results in:
	Pearson's Chi-squared test

data:  mtcars$disp and mtcars$mpg
X-squared = 658.67, df = 624, p-value = 0.1629

Warning message:
In chisq.test(mtcars$disp, mtcars$mpg) :
  Chi-squared approximation may be incorrect
Since the p-value (0.1629) is greater than the significance level (0.05), we do not reject the hypothesis that displacement is independent of miles per gallon.
Compute the chi-squared test on the hypothesis that miles per gallon is independent of the other variables:
> str(mtcars)
'data.frame':	32 obs. of  11 variables:
 $ mpg : num  21 21 22.8 21.4 18.7 18.1 14.3 24.4 22.8 19.2 ...
 $ cyl : num  6 6 4 6 8 6 8 4 4 6 ...
 $ disp: num  160 160 108 258 360 ...
 $ hp  : num  110 110 93 110 175 105 245 62 95 123 ...
 $ drat: num  3.9 3.9 3.85 3.08 3.15 2.76 3.21 3.69 3.92 3.92 ...
 $ wt  : num  2.62 2.88 2.32 3.21 3.44 ...
 $ qsec: num  16.5 17 18.6 19.4 17 ...
 $ vs  : num  0 0 1 1 0 1 0 1 1 1 ...
 $ am  : num  1 1 1 0 0 0 0 0 0 0 ...
 $ gear: num  4 4 4 3 3 3 3 4 4 4 ...
 $ carb: num  4 4 1 1 2 1 4 2 2 4 ...
Are any of the variables independent of mpg?
Submit your program as
Program #60.
In-class Quiz
During lab, there is a quiz (end of semester survey). The password to access the quiz will be given during lab.
What's Next?
If you finish the lab early, now is a great time to get a head start on the programming problems due early next week. There's instructors to help you and you already have Python up and running. The Programming Problem List has problem descriptions, suggested reading, and due dates next to each problem.
Using R at Home
To duplicate the setting in the lab, you will need to download