Pandas & Reading Data
To make reading files easier, we will use the pandas library that lets you read in CSV files very efficiently. Pandas, Python Data Analysis Library, is an elegant, open-source package for extracting, manipulating, and analyzing data, especially those stored in 2D arrays (like spreadsheets). It incorporates most of the Python constructs and libraries that we have seen thus far.
Pandas should be installed on all the lab machines. If you are using your own machine, you should check that it is there by typing at the Python shell (in spyder, idle, or your favorite Python interface):
import pandas as pd
If you get an error that the library is not found. Open up a terminal, and use conda to install it:
conda install pandasIn Pandas, the basic structure is a DataFrame which stored data in rectangular grids. Let's use this to visualize the change in New York City's population. First, start your file with an import statements for pandas:
import pandas as pdThe as pd allows us to use pandas commands without writing out pandas everytime-- instead we just write pd.
Next, save the NYC historical population data to the same directory as your program. Open the file in your favorite spreadsheet program (such as Excel) to see what it looks like. Note that it has 5 extra lines at the top before the column names occur. The pandas function for reading in CSV files is read_csv(). It has an option to skip rows which we will use here:
pop = pd.read_csv('nycHistPop.csv',skiprows=5)
Before going on, let's print out the variable pop. pop is a dataframe, described in the reading above:
print(pop)The last line of our first pandas program is:
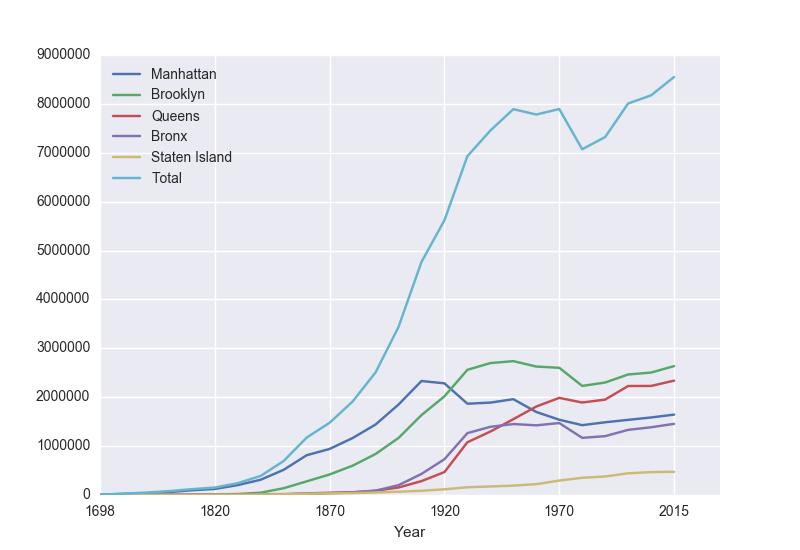
pop.plot(x="Year")which makes a graphical display of all of the data series in the variable pop with the series corresponding to the column "Year" as the x-axis. Your output should look something like:
To recap: the 3-line program:
import pandas as pd
pop = pd.read_csv('nycHistPop.csv',skiprows=5)
pop.plot(x="Year")
If you are using IDLE, you will need two more lines to make plots pop up automatically:
import matplotlib.pyplot as plt

import pandas as pd
pop = pd.read_csv('nycHistPop.csv',skiprows=5)
pop.plot(x="Year")

plt.show()
did the following:
- Imported the pandas library that contains structures and functions for organizing and visualizing data. (The additional line explicitly imports the pyplot library which pandas uses to create figures.)
- It read in a CSV file, containing NYC population historical data.
- It displayed the data as a visual plot of years versus borough populations.
- The last line in the version for IDLE shows the figure you created (spyder automatically displays it; in IDLE, you need to request that the plot you created be shown).
print("The largest number living in the Bronx is", pop["Bronx"].max())
Similarly the average (mean) population for Queens can be computed:
print("The average number living in the Queens is", pop["Queens"].mean())
Challenges
- What happens if you leave off the x = "Years"? Why?
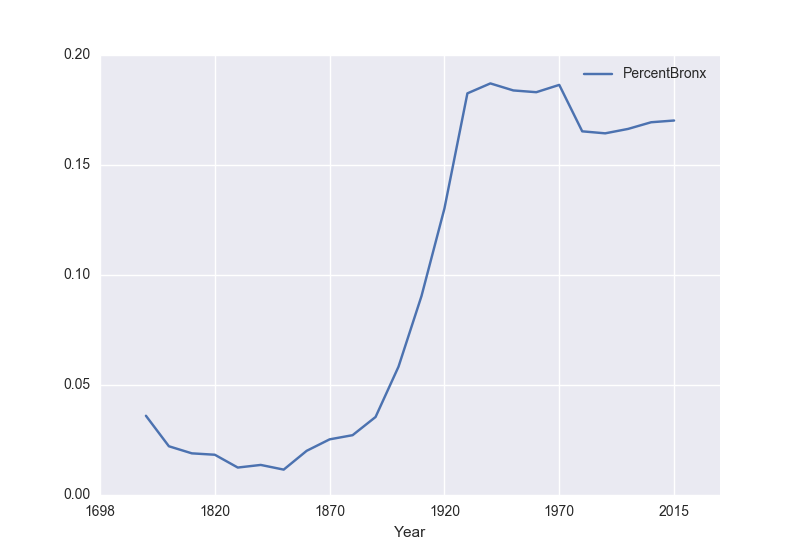
- What happens if you add in x = "Years", y = "Bronx"?
- What does the series functions: .min(), .std(), and .count() do?