Submit the following programs via the honors section of Gradescope:
- HC 1: Neighborhoods of the CitiBike Expansion Due Date: 3 September

Throughout the semester, we will focus on the upcoming expansion of CitiBike:
The de Blasio Administration joined Lyft to today announce the boundaries of the planned expansion of Citi Bike over the next five years, which will bring the nation's largest bike share system to a larger and more economically diverse range of communities. Last November, the City and Lyft announced an agreement in which Lyft would invest $100 million to grow and strengthen the system, doubling the size of its service area and tripling the number of bikes over the next five years. The third phase of Citi Bike's expansion will bring Citi Bike to all of Manhattan, as well as into the Bronx, and deeper into Brooklyn and Queens.
and how best to allocate the new bicycles to the next targeted neighborhoods in the South Bronx, Upper Manhattan, and Queens.To begin, pick a neighborhood (i.e. choose one and sign up on Blackboard). Create a single page summary of your neighborhood that includes:
- Name of the neighborhood (include in the title),
- The zip code(s) of your neighborhood,
- The census tracts encompassing your neighborhood (see Census Tract Finder),
- A map of New York City with your neighborhood highlighted,
- An photo or image that captures your neighborhood,
- The demographics of your neighborhood, and
- The distance of your neighborhood to Federal Hall and to Empire State Building.
Note: upload a .pdf to the assignment HC 1. in the honors section of Gradescope. Unlike the Python code, it is not automatically graded.
- HC 2: Neighborhood Rankings
Due Date: 9 September
Working in pairs or triples, design a ranking for most desirable features of a neighborhood.
There are multiple rankings of New York City Neighborhoods. For example,
- Niche,
- DNA Info's rankings,
- Brick Underground,
- Curbed's Walkable Neighborhoods,
- BuzzFeed,
- Street Advisor
- Assess what these rankings have in common and how they differ.
- Which ranking do you favor and why?
- What qualities make a neighborhood desirable place to live?
- Collate a list of the three most important.
Submit a .pdf file containing your assessment of the rankings and the three most desirable qualities. You should use complete sentences, compare and contrast the rankings above, and justify the three qualities that your group thought most important.
- HC 3: Walking in NYC Neighborhoods
Due Date: 16 September
Urban planner, Jeff Speck, argues that if a city succeeds at being walkable (and by extension, bikeable), it excels at having a high quality of life (see his TED talk).
Working in pairs or triples, analyze his argument in terms of five neighborhoods in New York City and the ranking you determined in HC 2. For five of the neighborhoods chosen by class (1-page summaries from HC 1 are available on Blackboard), determine the following:
- Rank the five neighborhoods by your ranking from HC 2. Explain how you determined the neighborhoods ranked (you can have ties, but you need to justify the rankings, even in the case of ties).
- How did the 5 neighborhoods do in terms of walkability (order the neighborhoods by their walk scores).
Does your ranking concur with ranking the neighborhoods by walkability? Justify your answer.
Submit a .pdf file analyzing the your rankings and walkability of five neighborhoods chosen for the class. You should use complete sentences and justify your answers with data.
- HC 4: Cost of Commuting
Due Date: 23 September
FiveThirtyEight analyzed the cost of commuting in terms of the extra New Yorkers were willing to pay to lessen their commute. StreetEasy did a similar analysis, measuring from given subway stops (and includes a lovely Tableaux map-- scroll down).
How will availability of CitiBikes affect housing prices? To narrow down the analysis, we will focus on the distance to two landmarks: Empire State Building (as a proxy for midtown) and Federal Hall (for the financial district) and 3 locations. You may find WNYC Transit Time or Google Maps useful, as well as CityMapper. Pick, at random, three rentals in your neighborhood.
- Compute the shortest commute driving to the Empire State Building or Federal Hall for those locations. Assume that you are arriving at 8:30am on a weekday.
- Compute the shortest commute by public transit to the Empire State Building or Federal Hall for those locations. Assume that you are arriving at 8:30am on a weekday and that you walk to the nearest station.
- Compute the shortest commute by public transit, assuming you bike between the apartment and station, to the Empire State Building or Federal Hall for those locations. Assume that you are arriving at 8:30am on a weekday.
Using the analysis from FiveThirtyEight, predict what the tunnel closure will do to the prices of your three chosen apartments. Justify your answer.
Submit a .pdf file analyzing the time and cost of commuting of your neighborhood. You should use complete sentences and justify your answers with data.
- HC 5: Highlighted Map
Due Date: 2 October
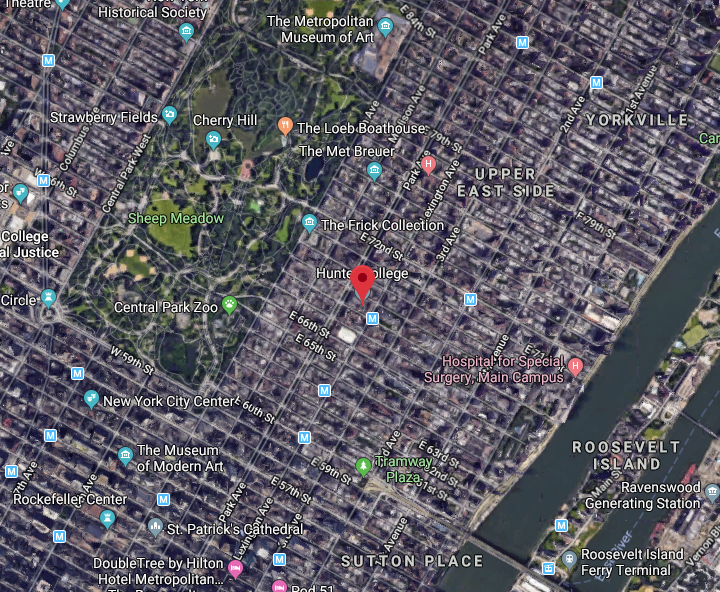
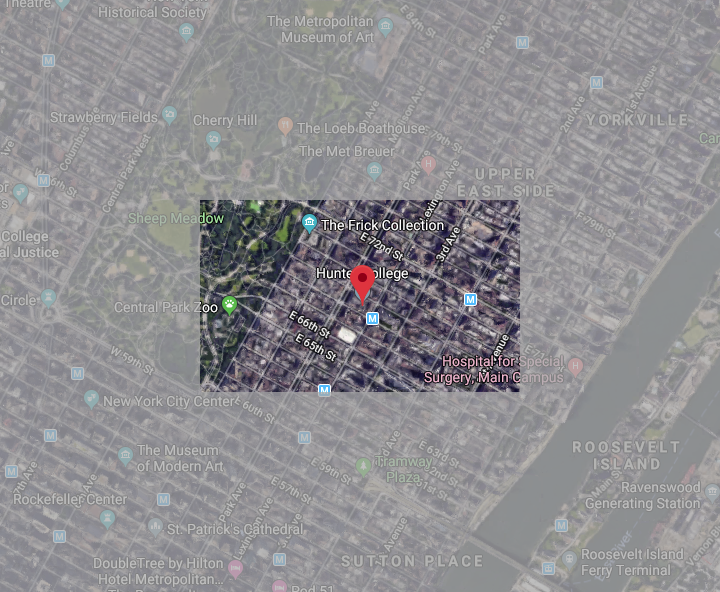
For this program, we will create a highlighted map around centered on your neighborhood, with the region within about a 1/4 mile box at full brightness, the region that outside that box at 50% brightness.
To do this:
- Create a .png file of a satellite map, centered on your neighborhood (Google maps works well for this, but you can use any mapping site to create your base map).
- Write a Python program that reads in an image and saves the image to another file. Run your program to make sure the reading and saving of an image works.
- Set the upper region of the image to 50% brightness (hint: uses slices and see example in Lecture 3 and 4). Run your program to make sure it has dimmed up the upper region and adjust to get the correct dimenssions.
- Set the lower region of the image to 50% brightness (hint: think about what negative numbers mean as indices). Run your program and fix any bugs.
- Next, dim the side regions (hint: think about what parts of the image have not been dimmed and change only those regions.)
Submit your answer as a .pdf file to gradescope.
- HC 6: Neighborhood Grid Due Date: 7 October
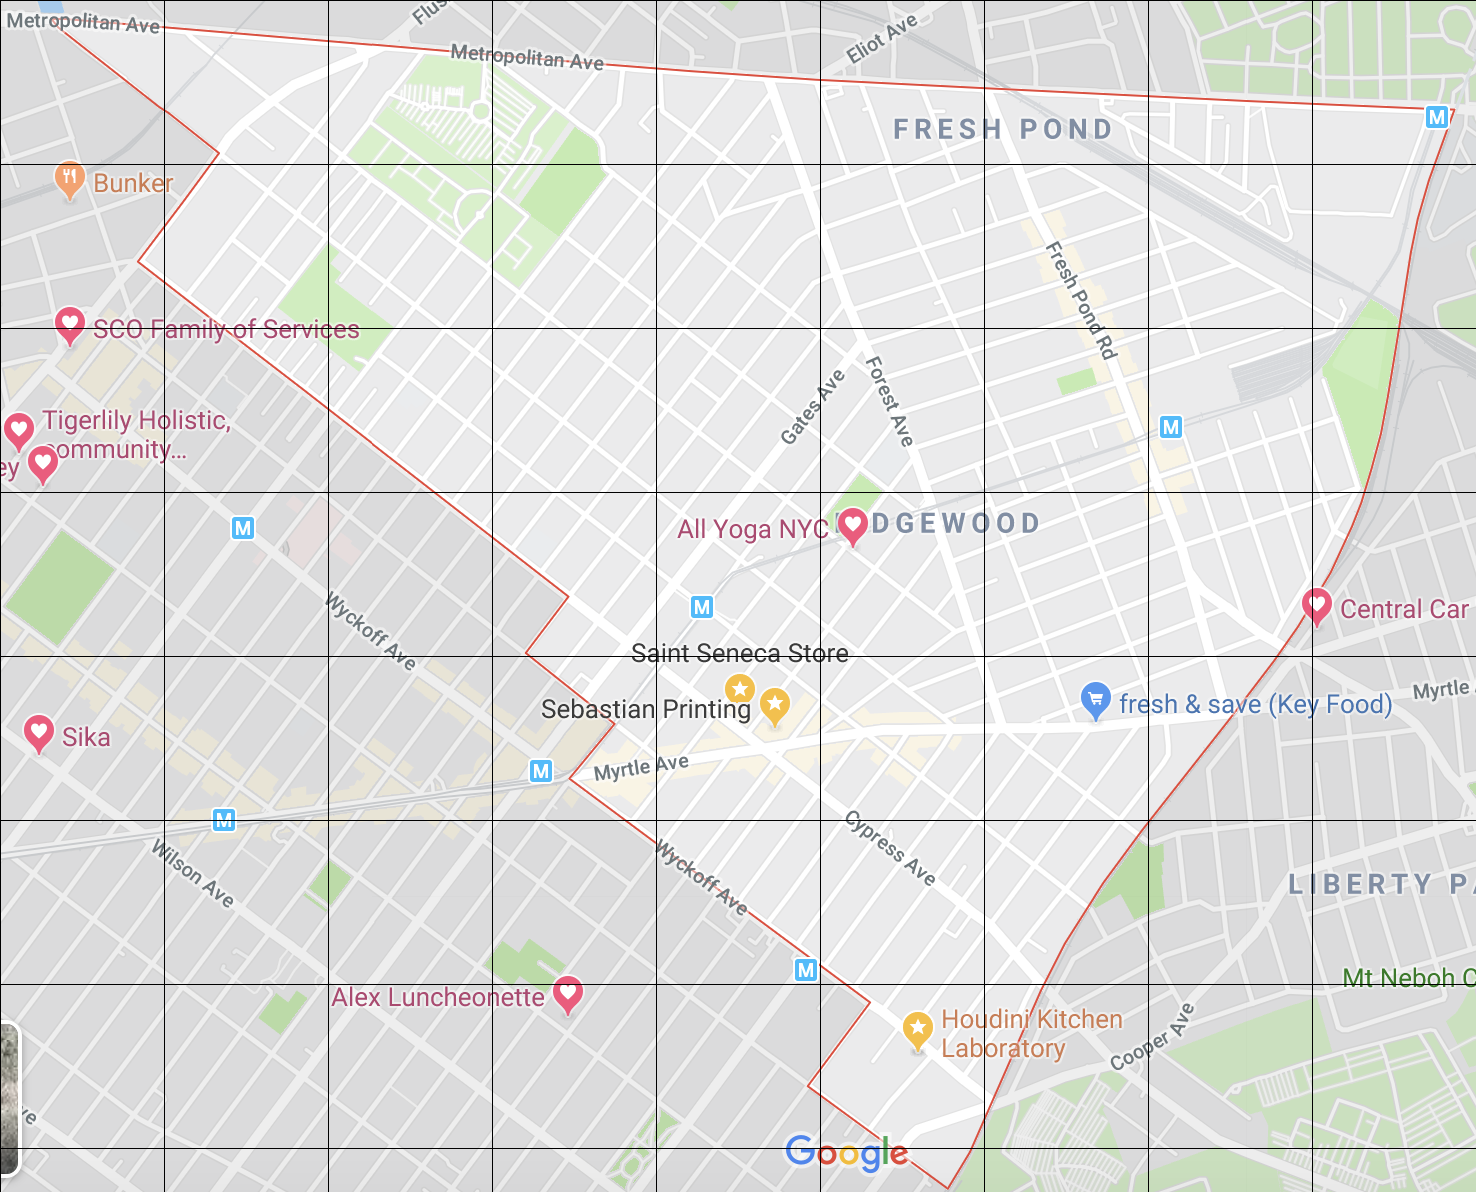
To determine where to place new bike stations, the NYC Department of Transportation, divided each region into 1000-square-foot grid (see p 25 of the NYC Bike Share Report for a sample grid).
Take an image of your neighborhood and overlay it with a 1000 square-foot grid.
To do this:
- Create a .png file of a map centered on your neighborhood (Google maps works well for this, you may look at the 1000ft bar in the lower right corner to determine how many squares in your image. Make sure your neighborhood is hilighted on the map).
- Write a Python program that reads in the image.
- Calculate your grid-interval based on how many 1000ft squares fit in your image.
- Change the color of each row and column in your image at the grid-interval you have determied to turn it black. (hint: uses slices and see example with intervals -- skipping rows/columns with step -- in Lecture 4).
- Save the image to another file.
Your answer should have your image on the first page and the code you used to generate the image on the next page. Submit your answer as a .pdf file to gradescope.
- HC 7: Station Density & Locations Due Date: 15 October
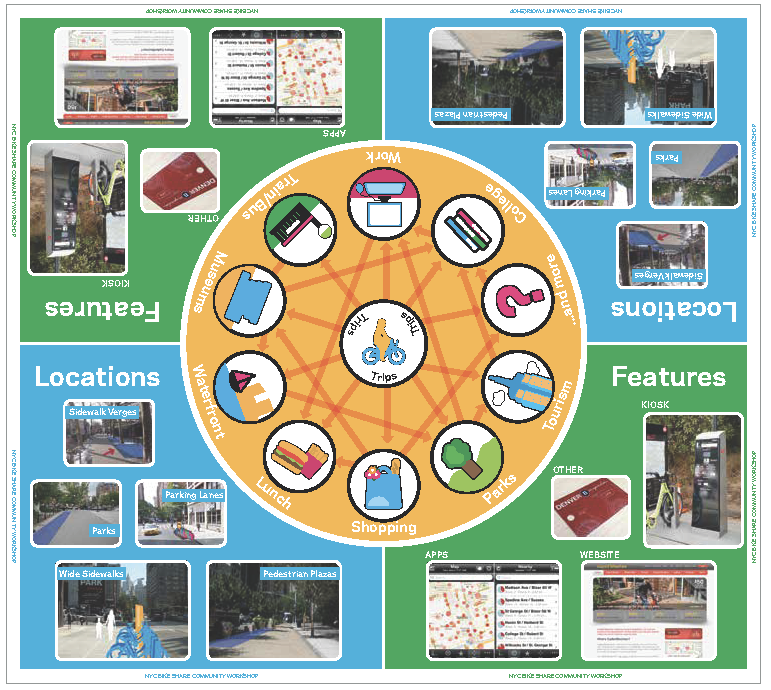
(Workshop Table Graphic, NYC Bike Share Report, p 26.)
Where should bike stations go in your neighborhood? The criteria outlined in the NYC Bike Share Report aimed to have at least one station per every 1000-square-feet and be near destinations such as train/bus stops, museums, shopping, and parks (see graphic above).
Identify 3-5 possible locations that would be a good location for a bike station in each grid location (include the cross streets or short description if mid-block, as well as which side-- such as "north east corner of the intersection") and a short justification of why that location would be good.
Your answer should contain your grid (from HC 6) and a itemized list with an entry of the locations for each region in the grid.
Submit your answer as a .pdf file to gradescope.
More to come...
- HC 8: Neighborhood geoJSON Map
Due Date: 21 October
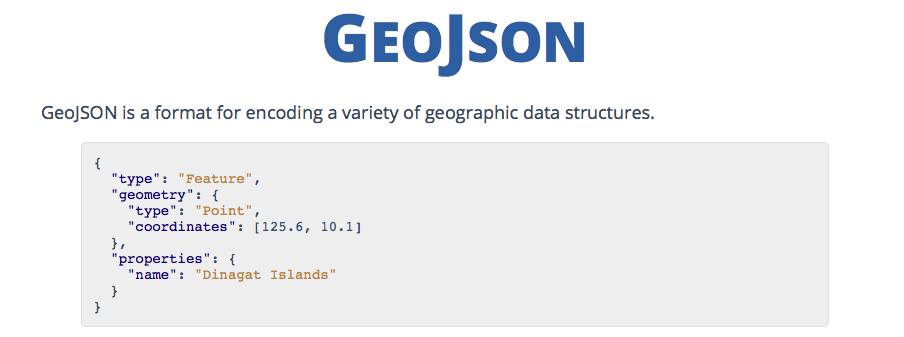
Using the geoJSON mapper (see geoJSON notes), make a JSON file that includes the following features:
- Your neighborhood marked as a region (e.g. polygon),
- Any subway lines (marked as a line: color code to match the MTA colors, e.g. the A line is blue, the 1 line is red, 4-5-6 lines are green),
- Green markers for your first choice of CitiBike stations, one for each 1000sft in your neighborhood grid.
- Yellow markers for your second choice of CitiBike stations, one for each 1000sft in your neighborhood grid.
Commit to github, and view using the github preview button (you should see you encoding rendered graphically on a map).
Submit a screenshot of your map as a .pdf file.
- HC 9: Webpage Due Date: 28 October
We are going to be using github to make webpages for your projects. There will be only one final site for each team, but we want everyone to set up their own page as a warm-up exercise.
Create a github page for your neighborhood.
- If you haven't done so already, set up a repository for your neighborhood project (see the getting started tutorials from Lab 5 on how to set up a repository).
- Follow through the options for setting up a page for your project (scroll down right under the "Ready to get started?...").
- Include on your neighborhood page:
- the name of the neighborhood,
- the basic demographics & statistics from the HC 1 and
- the outline of the neighborhood with your proposed CitiBike stations (the .json file you created in the previous classwork for HC 8),
Submit a .pdf file that contains the URL of your project on github (web address) and a screenshot of your webpage.
- HC 10: Project Plan Due Date: 4 November

The honors section will have final presentations on 6 December, addressing, the Expansion of CitiBike:
The de Blasio Administration joined Lyft to today announce the boundaries of the planned expansion of Citi Bike over the next five years, which will bring the nation's largest bike share system to a larger and more economically diverse range of communities. Last November, the City and Lyft announced an agreement in which Lyft would invest $100 million to grow and strengthen the system, doubling the size of its service area and tripling the number of bikes over the next five years. The third phase of Citi Bike's expansion will bring Citi Bike to all of Manhattan, as well as into the Bronx, and deeper into Brooklyn and Queens.
In particular,
Focusing on the expansion in three different boroughs, will the presence of CitiBike significantly affect residents' commute?
You will work with your team to develop your presentation, which has 2 parts:
- A 60-second lightning presentation (upto 2 slides) that contains who is on the team, the neighborhoods you chose, and a brief description of the effects you envision CitiBike's presence will have in these neighborhoods with particular focus on daily commute.
- A computer "poster" (aka a github site) consisting of a website with a description of your neighborhoods and an analysis of the effects of CitiBike's presence in these neighborhoods.
For this group assignment, include in a .pdf file:
- The neighborhoods that your team has chosen,
- The names of the team members,
- A discussion of how the presence of CitiBike will affect your neighborhoods (justify your claims with your answers to HC1 to HC4)
- HC 11: Citibike Map Due Date: 11 November
New York City's bike share program, CitiBike, provides extensive data about their system. The data is stored in the JSON format. In addition to directly reading in CSV files, Pandas has a built-in function for reading in JSON files.
Citibike includes a real-time feed of the status of stations in the system. The feed is in JSON. Here's the beginning of the file:
{"executionTime":"2017-03-21 10:37:12 PM",
"stationBeanList":[
{"id":72,"stationName":"W 52 St & 11 Ave","availableDocks":18,"totalDocks":39,"latitude":40.76727216,"longitude":-73.99392888, "statusValue":"In Service",
"statusKey":1,"availableBikes":19,"stAddress1":"W 52 St & 11 Ave","stAddress2":"","city":"","postalCode":"","location":"","altitude":"","testStation":false,
"lastCommunicationTime":"2017-03-21 10:36:30 PM","landMark":""},
{"id":79,"stationName":"Franklin St & W Broadway","availableDocks":31,"totalDocks":33,"latitude":40.71911552,"longitude":-74.00666661,"statusValue":"In Service",
"statusKey":1,"availableBikes":0,"stAddress1":"Franklin St & W Broadway","stAddress2":"","city":"","postalCode":"","location":"","altitude":"","testStation":false,
"lastCommunicationTime":"2017-03-21 10:33:23 PM","landMark":""},
{"id":82,"stationName":"St James Pl & Pearl St","availableDocks":23,"totalDocks":27,"latitude":40.71117416,"longitude":-74.00016545,"statusValue":"In Service",
"statusKey":1,"availableBikes":4,"stAddress1":"St James Pl & Pearl St","stAddress2":"","city":"","postalCode":"","location":"","altitude":"","testStation":false,
"lastCommunicationTime":"2017-03-21 10:34:12 PM","landMark":""},
It begins with the time the file was created, followed by information about each station in a field marked stationBeanList. Each entry is organized as dictionary with (key:value) pairs. Let's look at the bean list entry for the first station:
   {"id":72,
   "stationName":"W 52 St & 11 Ave",
   "availableDocks":18,
   "totalDocks":39,
   "latitude":40.76727216,
   "longitude":-73.99392888,
   "statusValue":"In Service",
   "statusKey":1,
   "availableBikes":19,
   "stAddress1":"W 52 St & 11 Ave",
   "stAddress2":"",
   "city":"",
   "postalCode":"",
   "location":"",
   "altitude":"",
   "testStation":false,
   "lastCommunicationTime":"2017-03-21 10:36:30 PM",
   "landMark":""}
Which ones are useful for making a map? We need latitude and longitude. For our popup message, it would also be good to give location as well as the number of bikes available and number of docks. If we called the stationBeanList entry for a station, beanList, these entries would be:
   beanList['latitude']
   beanList['longitude']
   beanList['name']
   beanList['availableBikes']
   beanList['totalDocks']
To build our map, we need to:
- Read in the json file.
- Create a map object (variable).
- Extract the location, name, and bike information for each dock.
- Add a marker for each dock to our map.
- Save our map.
The new part is reading in a json file, but pandas has a built-in method to do that for us: read_json():
stations = pd.read_json('https://feeds.citibikenyc.com/stations/stations.json')The second step, creating a map object, is the same as before:
mapBikes = folium.Map(location=[40.75, -73.99],tiles="Cartodb Positron",zoom_start=14)
Extracting the information from each row has an added level, since the information is stored in the dictionary, stationBeanList. To make the lines more readable, we will save row['stationBeanList'] as the variable beanList. The rest of the for is the same as previous prorgrams:
for i,row in stations.iterrows():
    beanList = row['stationBeanList']
    lat = beanList['latitude']
    lon = beanList['longitude']
    name = beanList['stationName'] + ": " + str(beanList['availableBikes']) + " bikes available of " + str(beanList['totalDocks']) + " total bikes"
    print(name)
    if beanList['statusValue'] == 'Not In Service':
        name = beanList['stationName'] + ": Not In Service"
        i = folium.Icon(color='lightgray')
    else:
        name = beanList['stationName'] + ": " + str(beanList['availableBikes']) + " bikes available of " + str(beanList['totalDocks']) + " total bikes"
        if beanList['availableBikes'] < 2:
            i = folium.Icon(color='red')
        else:
            i = folium.Icon(color='green')
    folium.Marker([lat,lon],popup = name,icon = i).add_to(mapBikes)


#Create the html file with the map:
mapBikes.save(outfile='bikeLocations.html')
Putting this altogether gives the python program, cbStations.py.
Note: You can directly read from a URL, as we did in this program, or if you would like to work off-line, you can download the JSON file, save it locally, and use it as before.
Modify the program in the following way:
- Modify the popup message to give the percent full the station is
(i.e. the percentage of docks full at a station).
Hint: compute the percentage and then add it to your message-- remember to cast/convert it to string. - Modify the program to only show a red marker if there are less than 25% of the bikes available (currently, it shows it for < 2).
Submit a .pdf that contains a screenshot of your map on the first page and the Python program that produces it on the next page.
- HC 12: Catchments for Proposed Bike Stations Due Date: 18 November
A Voronoi diagram divides a region based on the distance to a set of input points. This simple idea has many applications, one of the most famous was the work of John Snow to study the 1854 cholera outbreak. Our focus will be on mapping current and proposed CitiBike stations.
The sample program builds a Voronoi diagram for the existing CitiBike stations. The map highlights the regions closest to each station:
To make our map, we
- First extract the relevant station data from the Citibike real-time feed we used in the previous assignment. Because the feed is in JSON, we extract the relevant data into a new dataframe to facilitate the addition of new stations.
- Next take station locations and calculate the Voronoi diagram (using the scipy package).
- While going row by row to get the station locations, add markers to the map (we're adding them as separate markers, not a MarkerCluster, since we don't want them to collapse when zooming out).
- Show the plot in a matplotlib window to make sure its working (note: if you have a separate matplotlib window you may need to close it, since the rest of the program is waiting until it's done to continue).
- Then write out the locations as a geojson file (using the geojson).
- Load the regions in as a geoJSON layer in folium.
If you are using anaconda (either spyder, idle3, or jupyter), the scipy and matplotlib packages are included. To install geojson, type at a terminal window:
pip install geojsonThe program, makeVorBikes.py, is a bit rambling, but contains all the steps above (a better design would be to split into separate functions or files for the different tasks).
Try running it. Note that it does very well in dense regions but has odd behavior on the edges of the map since we didn't include in the .json file any point at infinity and didn't clip the maps to the city boundaries.
Modify the program as follows:
- Find the latidude and longitude for each of the bike stations you proposed in HC 8 (first choice only).
- Add rows in the stations dataframe for the stations you propose. You can call your stations Proposed1 ... Proposedn and set their 'statusValue' to 'Proposed'
- Change the color of the markers on the map based on the 'statusValue' and set it to 'lightgray' if the staus is 'Not In Service', 'red' if the staus is 'Proposed' and 'green' for all other.
Run the program now and observe how your proposed bike stations cover your neighborhood.
Submit a .pdf file with the name of your neighborhood and a screen capture image of the HTML map generated with your modifications on the first page and a copy of your modfied program on the second page.
- HC 13: Project Webpage Due Date: 25 November
Submit the URL of your group webpage poster/presentation as part of a .pdf file. If you have plans to add more to the website, include in the .pdf file any changes you have planned but didn't have a chance to enter yet.
- HC 14: Draft Presentations Due Date: 2 December
Feedback Forms will be passed out and returned in section on November 29. Each team will review and comment the other teams' slides and webpage by filling out fdeedback forms. After you have commented on others' group presentations, we will distribute the forms so that groups can use these to improve their slides and webpages for the final presentation on December 6.
Submit the revised slides of your group presentation (two slides total) as a .pdf file. Your slides should include who is on the team, the neighborhood you chose, and a brief description of your proposed citibike expansion and how it will affect your neighborhoods.