Program 4: City Dogs
CSci 39542: Introduction to Data Science
Department of Computer Science
Hunter College, City University of New York
Spring 2023
Classwork Quizzes Homework Project
Program Description
Program 4: City Dogs. Due 10am, Wednesday, 22 February.
Learning Objective: to enhance data cleaning skills from reading in raw data, imputing values, and formatting date and string data.
Available Libraries: datetime, pandas, and core Python 3.6+.
Data Sources:
NYC Dog Licensing Data from OpenData NYC,
NYC Zip Codes by Borough from BetaNYC,
DOHMH Dog Bite Data from OpenData NYC.
Sample Datasets:
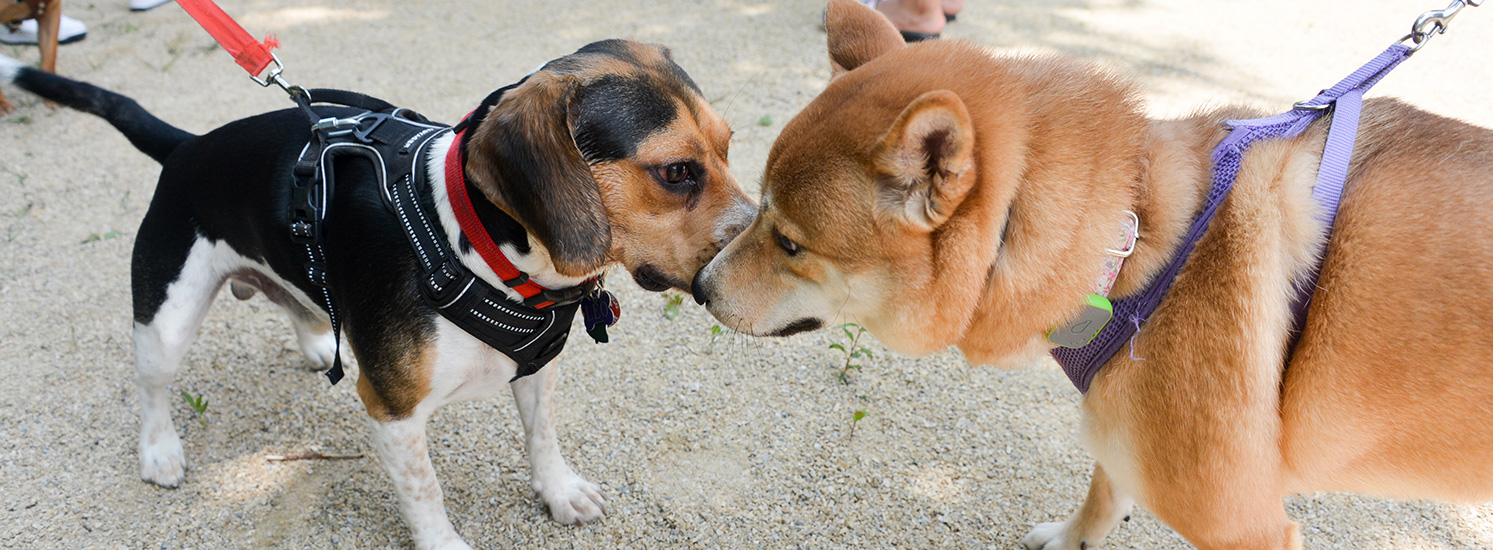
This program focuses on cleaning and imputing data. We're using data about dogs in New York City. All dog owners are required by law to license their dogs via the DOHMH Dog Licensing System. Each record represents a unique dog license that was active during the year and includes information about the dog as well as the zipcode of the owner. It doesn't include the borough, but we can add that via data collated by BetaNYC.
The NYC Department of Health also provides the data it collects on reported dog bites. Many of the reports have missing fields, such as the breed of the dog and age. Dropping any row with incomplete data (e.g. dropna()) would lose valuable information. For many features, we can "impute" the missing values (see Chapter 9). For example, for the breed of dog, one possible entry is "Unknown". If that field is empty, filling in the entry with "Unknown" is a logical approach. For entries that have the borough, but not the zipcode, we can use the zipcode of the main post office of that borough.
The assignment is broken into the following functions to allow for unit testing:
-
make_dog_df(license_file,zipcode_file):: This function takes two inputs:-
license_file: the name of a CSV file containing NYC Dog Licensing Data from OpenData NYC, and zipcode_file: the name of a CSV file containing BetaNYC's NYC Zip Codes by Borough.
- The names of the dogs
AnimalNameshould be capitalized. - The columns,
'LicenseExpiredDate', 'Extract Year'should be dropped. - The two DataFrames should be (left) merged on zipcodes.
- Any reported dogs not in NYC (i.e. have
NaNforBoroughin the combined DataFrame) should be dropped.
-
-
make_bite_df(file_name): This function takes one input:-
file_name: the name of a CSV file containing DOHMH Dog Bite Data from OpenData NYC.
file_nameas DataFrame, dropping theSpeciescolumn. The resulting DataFrame is returned. -
-
clean_age(age_str): This function takes one input:-
age_str: a string containing the age of the dog.
- If
age_strends in aY, return the rest of the string as a number. For example,3Yrepresents 3 years and the return value is3. - If
age_strends in aM, return the rest of the string as a number in years. For example,6Mrepresents 6 months and the return value is0.5. - If
age_strcontains only a number, return it as a number. For example,3represents 3 years and the return value is3. - For all other values, return
None.
-
-
clean_breed(breed_str): This function takes one input:-
breed_str: a string containing the breed of the dog.
- If
breed_stris empty, return"Unknown". - Otherwise, return the string in title format with each word in the string capitalized and all other letters lower case. For example, If the input is
BEAGLE MIXED, you should returnBeagle Mixed.
-
-
impute_age(df): This function takes one input:-
df: a DataFrame containing the columnAge Num.
df['Age Num']column with the median of the values of the column. The resulting DataFrame is returned. -
-
impute_zip(boro, zipcode): This function takes two inputs:-
boro: a non-empty string containing the borough. -
zipcode: a possibly empty string containing the zip code.
zipcodecolumn is empty, impute the value with the zip code of the general delivery post office based on value ofboro: 10451 for Bronx, 11201 for Brooklyn, 10001 for Manhattan, 11431 for Queens, 10341 for Staten Island, and None for Other. -
-
parse_datetime(df, column='LicenseIssuedDate'): This function takes two inputs:-
df: a DataFrame containing the columncolumn.columnhas a default value of'LicenseIssuedDate'
timestamp: contains thedatetimeobject corresponding to the string stored incolumn.month: return the number corresponding to the month oftimestamp: 1 for January, 2 for February, ... 12 for December.day_of_week: return the number corresponding to the day of the week oftimestamp: 0 for Monday, 1 for Tuesday, ... 6 for Sunday.
-
For example, we can use our first function to make a DataFrame of the dogs licensed in 2021, with the names capitalized and borough information (data files linked above):
dog_df = make_dog_df("NYC_Dog_Licensing_Dataset_2021.csv","nyc_zip_borough_neighborhoods_pop.csv")
print(dog_df) AnimalName AnimalGender AnimalBirthYear BreedName ZipCode LicenseIssuedDate Borough
0 Waldorf M 2006 Havanese 10065 2021-01-01 Manhattan
1 Bailey F 2008 Yorkshire Terrier 11104 2021-01-01 Queens
2 Muki F 2006 American Eskimo dog 10038 2021-01-01 Manhattan
3 Luna F 2009 Chihuahua 11201 2021-01-01 Brooklyn
5 Coco M 2011 Boxer 10472 2021-01-01 Bronx
... ... ... ... ... ... ... ...
77732 Luff M 2021 Rottweiler 11365 2021-12-31 Queens
77733 Appa M 2013 Goldendoodle 10027 2021-12-31 Manhattan
77734 Salvano F 2021 Pomeranian 11223 2021-12-31 Brooklyn
77735 Name not provided F 2021 Yorkshire Terrier 11206 2021-12-31 Brooklyn
77736 Hudson M 2021 Pembroke Welsh Corgi 10314 2021-12-31 Staten Island
[76670 rows x 7 columns]Let's also add in the new columns for the date (as a timedate object), the month, and the day of the week:
dog_df = parse_datetime(dog_df)
print(dog_df) AnimalName AnimalGender AnimalBirthYear BreedName ZipCode LicenseIssuedDate Borough timestamp month day_of_week
0 Waldorf M 2006 Havanese 10065 01/01/2021 Manhattan 2021-01-01 1 4
1 Bailey F 2008 Yorkshire Terrier 11104 01/01/2021 Queens 2021-01-01 1 4
2 Muki F 2006 American Eskimo dog 10038 01/01/2021 Manhattan 2021-01-01 1 4
3 Luna F 2009 Chihuahua 11201 01/01/2021 Brooklyn 2021-01-01 1 4
5 Coco M 2011 Boxer 10472 01/01/2021 Bronx 2021-01-01 1 4
... ... ... ... ... ... ... ... ... ... ...
77732 Luff M 2021 Rottweiler 11365 12/31/2021 Queens 2021-12-31 12 4
77733 Appa M 2013 Goldendoodle 10027 12/31/2021 Manhattan 2021-12-31 12 4
77734 Salvano F 2021 Pomeranian 11223 12/31/2021 Brooklyn 2021-12-31 12 4
77735 Name not provided F 2021 Yorkshire Terrier 11206 12/31/2021 Brooklyn 2021-12-31 12 4
77736 Hudson M 2021 Pembroke Welsh Corgi 10314 12/31/2021 Staten Island 2021-12-31 12 4
[76670 rows x 10 columns]Let's take a look at the data. Now that all the names are capitalized the same, we can see which are the most popular in 2021:
print('Most popular names are:')
print(dog_df['AnimalName'].value_counts()[:10])
Most popular names are:
Unknown              2955
Name not provided    1269
Bella                 872
Luna                  774
Max                   649
Charlie               612
Coco                  557
Lola                  508
Teddy                 472
Milo                  467
Name: AnimalName, dtype: int64
import seaborn as sns
import matplotlib.pyplot as plt
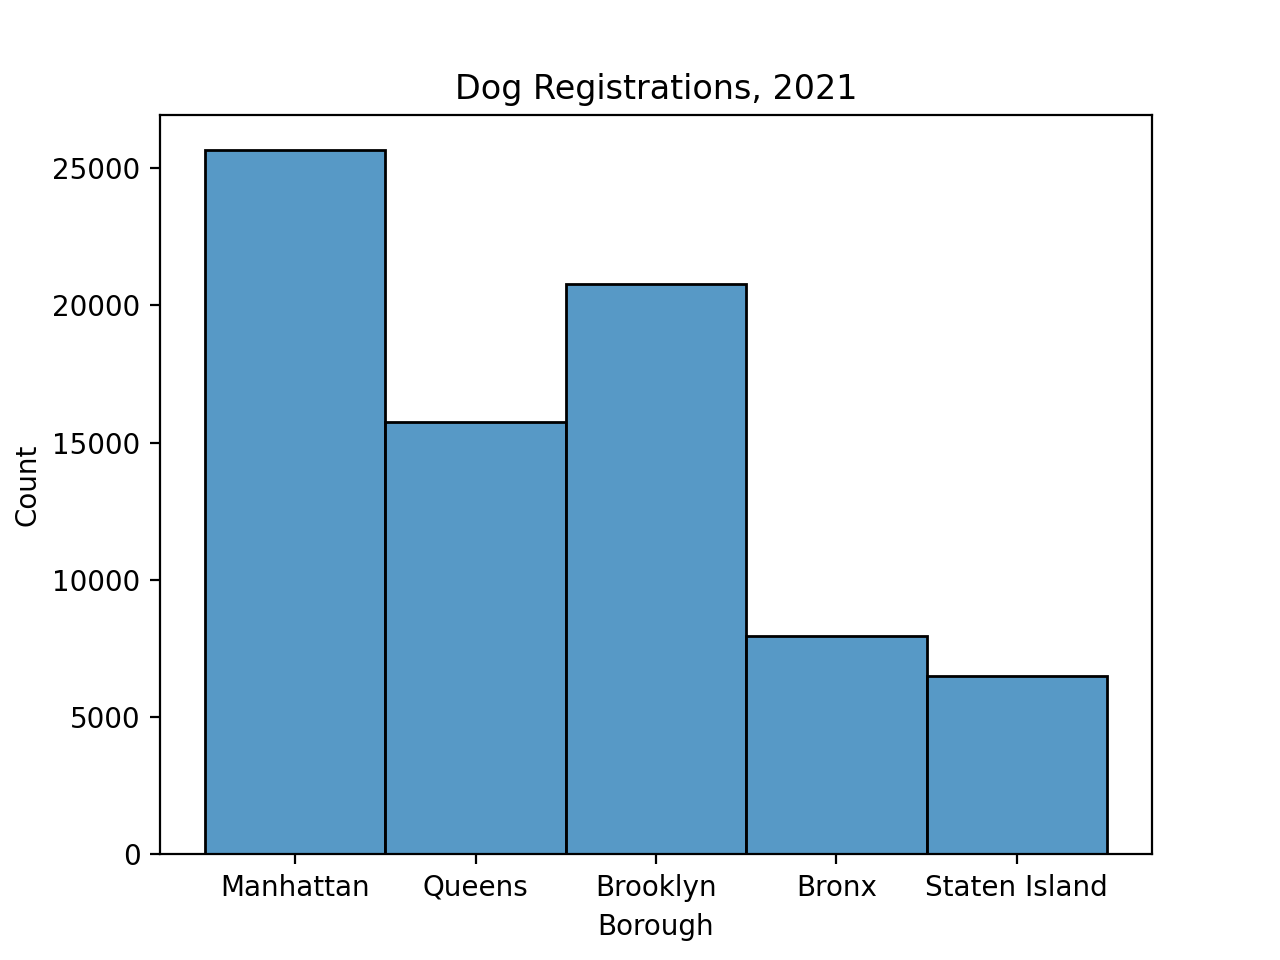
sns.histplot(data=dog_df, x="Borough")
plt.title('Dog Bites, 2021')
plt.show()
Next, let's set up the dog bite DataFrame:
bite_df = make_bite_df("DOHMH_Dog_Bite_Data_2021.csv")
print(bite_df) UniqueID DateOfBite Breed Age Gender SpayNeuter Borough ZipCode
0 2055 January 01 2021 MIXED BREED 5 F False Brooklyn 11228.0
1 4308 January 01 2021 LARGE MIXED BREED 2 M False Bronx 10468.0
2 4309 January 01 2021 LARGE MIXED BREED 2 M False Bronx 10463.0
3 4310 January 01 2021 LARGE MIXED BREED 2 M False Bronx 10463.0
4 6963 January 01 2021 Pomeranian NaN U False Manhattan 10038.0
... ... ... ... ... ... ... ... ...
2916 4729 December 29 2021 Bull dog NaN U False Bronx 10459.0
2917 7645 December 30 2021 Shih Tzu NaN U False Manhattan 10032.0
2918 11439 December 30 2021 UNKNOWN NaN U False Queens NaN
2919 11440 December 30 2021 Dachshund Smooth Coat 7 M True Queens 11369.0
2920 2700 December 31 2021 UNKNOWN NaN U False Brooklyn 11233.0
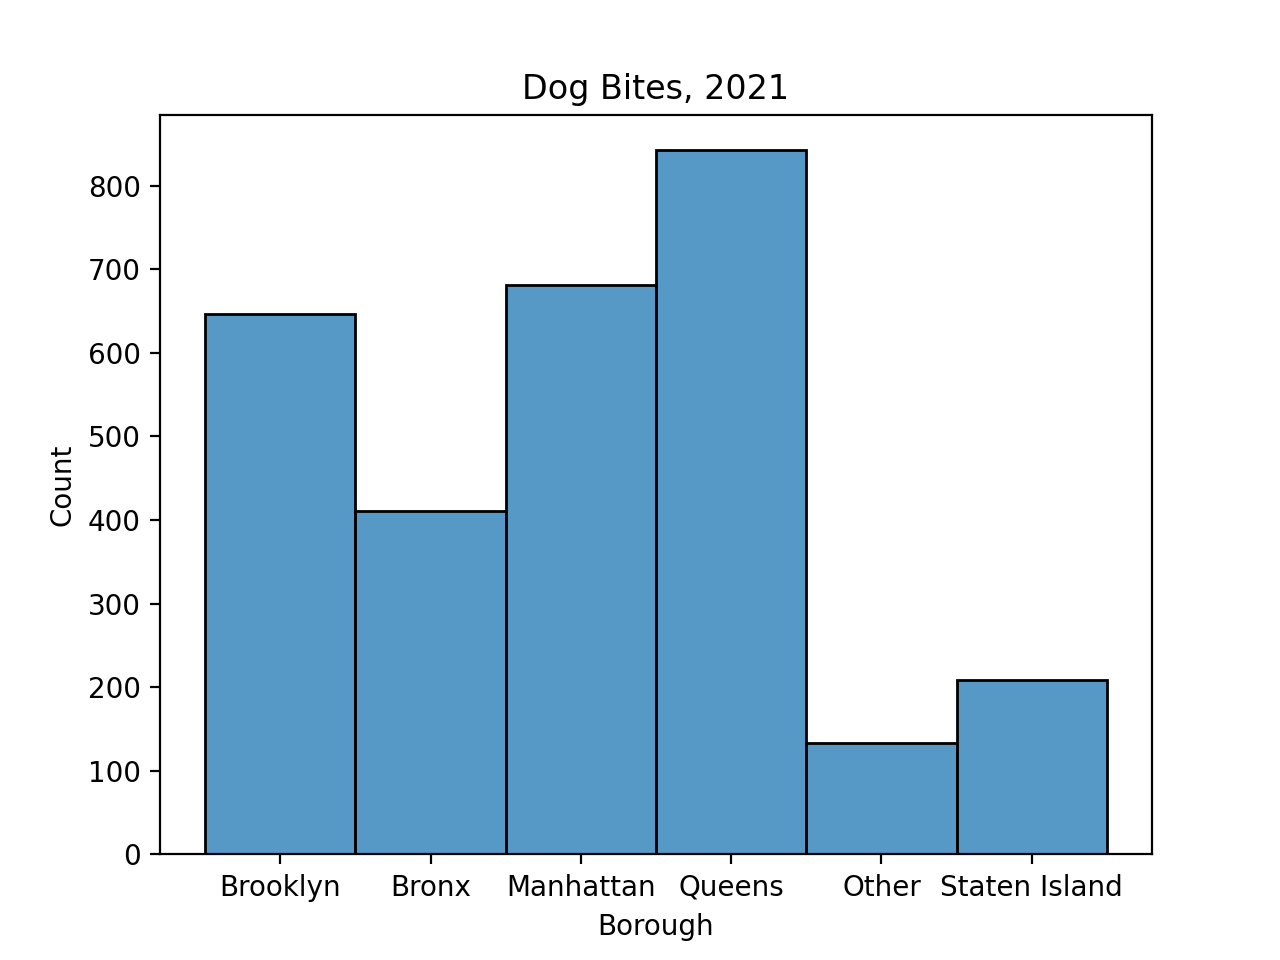
[2921 rows x 8 columns]sns.histplot(data=bite_df, x="Borough")
plt.show()
If we dropped all rows with undefined values:
df_drop = bite_df.dropna()
print(f'The full DataFrame has {len(bite_df)} entries.')
print(f'Dropping undefined values leaves {len(df_drop)} entries.')
The full DataFrame has 2921 entries.
Dropping undefined values leaves 959 entries.
Instead, let's impute values, using the functions above. Starting with the Age column, which mostly stored as number of years, but also has the age in months (e.g. 6M) but also some unexpected entries such as:
4-6MOS. If the entry is not a number, or a number followed by M or Y, our function returns None.
bite_df['Age Num'] = bite_df['Age'].apply(clean_age)
print(bite_df[['Age','Age Num']])clean_age is applied to to the age column of the DataFrame, and the results are stored in a new column, Age Num:
      Age  Age Num
0       5      5.0
1       2      2.0
2       2      2.0
3       2      2.0
4     NaN      NaN
...   ...      ...
2916  NaN      NaN
2917  NaN      NaN
2918  NaN      NaN
2919    7      7.0
2920  NaN      NaN

[2921 rows x 2 columns]
Next, let's clean up the breeds, replacing empty entries with Unknown and standardizing capitalization:
bite_df['Breed'] = bite_df['Breed'].apply(clean_breed)
print(bite_df) UniqueID DateOfBite Breed Age Gender SpayNeuter Borough ZipCode Age Num
0 2055 January 01 2021 Mixed Breed 5 F False Brooklyn 11228.0 5.0
1 4308 January 01 2021 Large Mixed Breed 2 M False Bronx 10468.0 2.0
2 4309 January 01 2021 Large Mixed Breed 2 M False Bronx 10463.0 2.0
3 4310 January 01 2021 Large Mixed Breed 2 M False Bronx 10463.0 2.0
4 6963 January 01 2021 Pomeranian NaN U False Manhattan 10038.0 NaN
... ... ... ... ... ... ... ... ... ...
2916 4729 December 29 2021 Bull Dog NaN U False Bronx 10459.0 NaN
2917 7645 December 30 2021 Shih Tzu NaN U False Manhattan 10032.0 NaN
2918 11439 December 30 2021 Unknown NaN U False Queens NaN NaN
2919 11440 December 30 2021 Dachshund Smooth Coat 7 M True Queens 11369.0 7.0
2920 2700 December 31 2021 Unknown NaN U False Brooklyn 11233.0 NaN
[2921 rows x 9 columns]Next, let's impute, or fill in the missing values, for Age Num with the median and the zipcode with the general delivery post office:
bite_df = impute_age(bite_df)
bite_df['ZipCode'] = bite_df.apply(lambda row: impute_zip(row['Borough'],row['ZipCode']),axis=1)
print(bite_df) UniqueID DateOfBite Breed Age Gender SpayNeuter Borough ZipCode Age Num
0 2055 January 01 2021 Mixed Breed 5 F False Brooklyn 11228 5.0
1 4308 January 01 2021 Large Mixed Breed 2 M False Bronx 10468 2.0
2 4309 January 01 2021 Large Mixed Breed 2 M False Bronx 10463 2.0
3 4310 January 01 2021 Large Mixed Breed 2 M False Bronx 10463 2.0
4 6963 January 01 2021 Pomeranian NaN U False Manhattan 10038 4.0
... ... ... ... ... ... ... ... ... ...
2916 4729 December 29 2021 Bull Dog NaN U False Bronx 10459 4.0
2917 7645 December 30 2021 Shih Tzu NaN U False Manhattan 10032 4.0
2918 11439 December 30 2021 Unknown NaN U False Queens 11431 4.0
2919 11440 December 30 2021 Dachshund Smooth Coat 7 M True Queens 11369 7.0
2920 2700 December 31 2021 Unknown NaN U False Brooklyn 11233 4.0
[2921 rows x 9 columns]We can use again the function parse_datetime to add that information, this time to the DataFrame: bite_df:
bite_df = parse_datetime(bite_df,column='DateOfBite')
print(bite_df) UniqueID DateOfBite Breed Age Gender SpayNeuter Borough ZipCode Age Num timestamp month day_of_week
0 2055 January 01 2021 Mixed Breed 5 F False Brooklyn 11228 5.0 2021-01-01 1 4
1 4308 January 01 2021 Large Mixed Breed 2 M False Bronx 10468 2.0 2021-01-01 1 4
2 4309 January 01 2021 Large Mixed Breed 2 M False Bronx 10463 2.0 2021-01-01 1 4
3 4310 January 01 2021 Large Mixed Breed 2 M False Bronx 10463 2.0 2021-01-01 1 4
4 6963 January 01 2021 Pomeranian NaN U False Manhattan 10038 4.0 2021-01-01 1 4
... ... ... ... ... ... ... ... ... ... ... ... ...
2916 4729 December 29 2021 Bull Dog NaN U False Bronx 10459 4.0 2021-12-29 12 2
2917 7645 December 30 2021 Shih Tzu NaN U False Manhattan 10032 4.0 2021-12-30 12 3
2918 11439 December 30 2021 Unknown NaN U False Queens 11431 4.0 2021-12-30 12 3
2919 11440 December 30 2021 Dachshund Smooth Coat 7 M True Queens 11369 7.0 2021-12-30 12 3
2920 2700 December 31 2021 Unknown NaN U False Brooklyn 11233 4.0 2021-12-31 12 4
[2921 rows x 12 columns]Now that we have the data cleaned up, let's look at when dog bites happen:
sns.histplot(data=bite_df, x="month",discrete=True)
plt.xticks(range(1,13),
    ['Jan','Feb','Mar','Apr','May','Jun','Jul','Aug','Sep','Oct','Nov','Dec'])
plt.title('Dog Bites, 2021')
plt.show()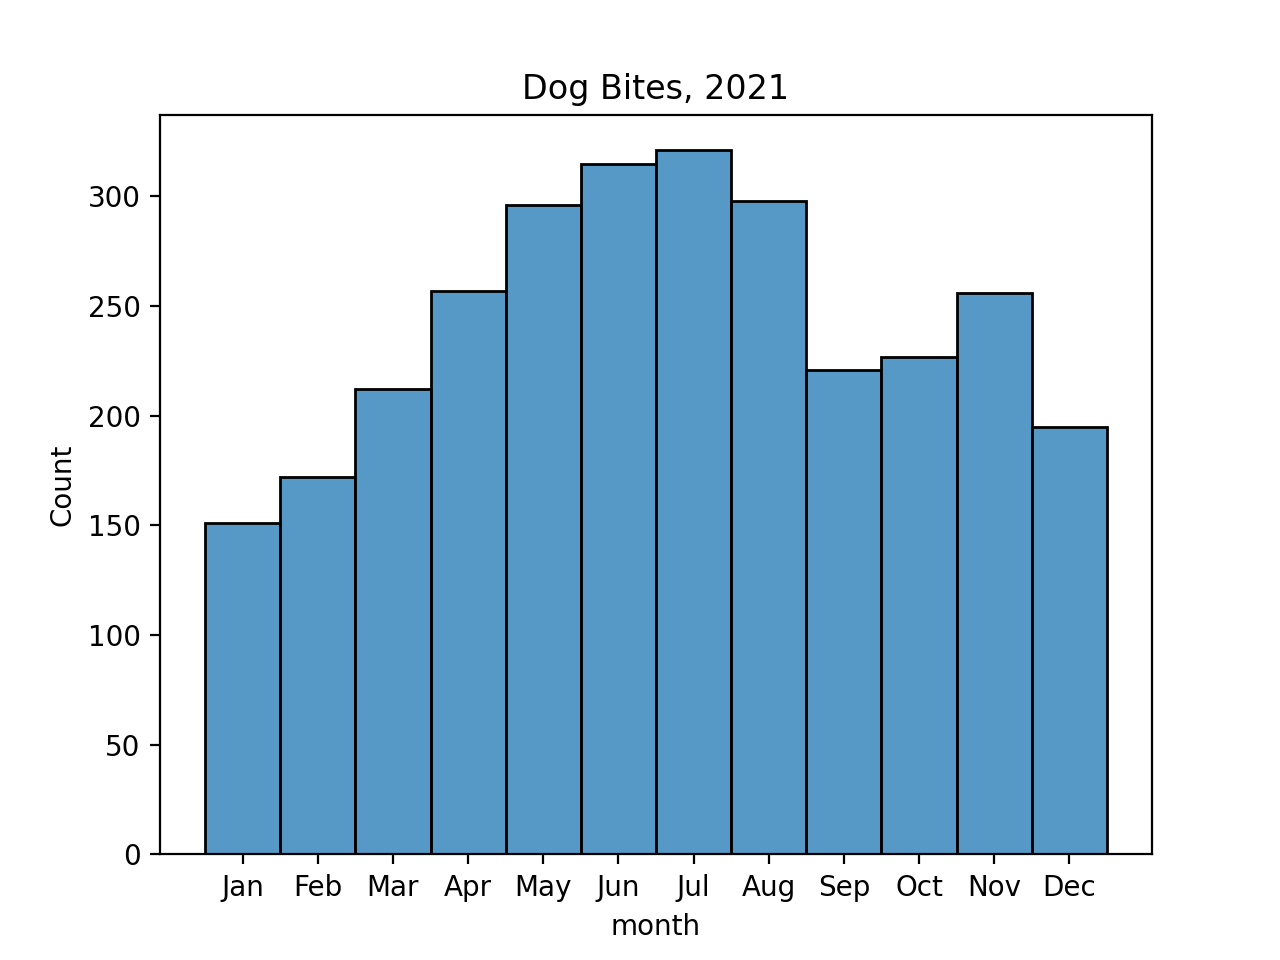
and by day of the week:
sns.histplot(data=bite_df, x="day_of_week")
plt.xticks(range(7),['Mon','Tue','Wed','Thu','Fri','Sat','Sun'])
plt.title('Dog Bites, 2021')
plt.show()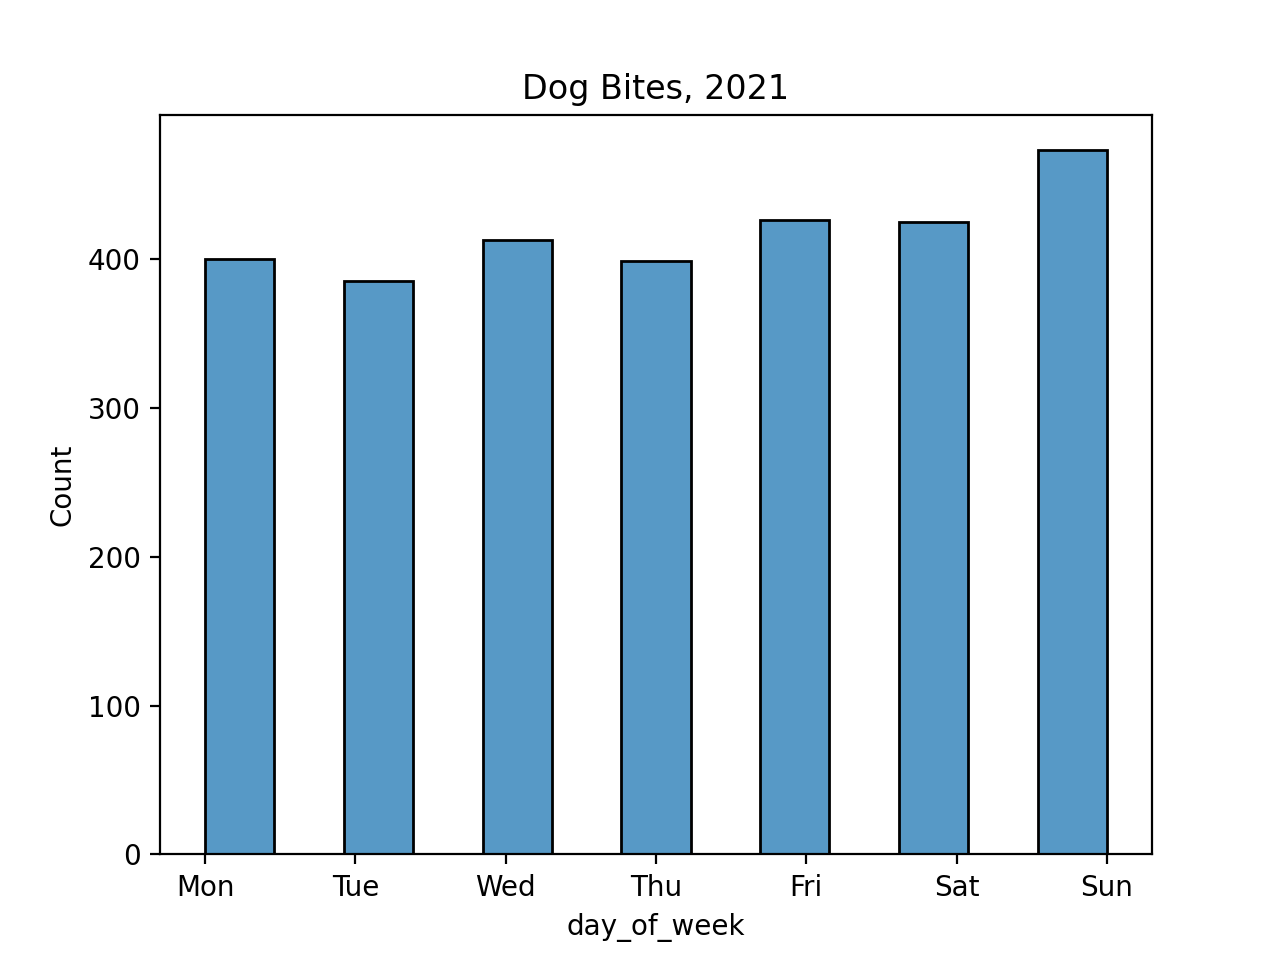 Hints:
- You should submit a .py file with only the standard comments at the top, the specified functions, and any helper functions you have written. The grading scripts will then import the file for testing. If your file includes code outside of functions, either comment the code out before submitting or use a main function that is conditionally executed (see Think CS: Section 6.8 for details).
- Include only the libraries you need (such as
pandas) for your functions and none of the ones for plotting (such asmatplotlib.pyplotandseaborn) since the functions submitted are computing and not plotting. Only the libraries listed in Available Libraries are loaded by the autograder. - See Lecture 3 or DS 100: Section 9.4 for working with dates and times.
- See DS 100: Chapter 11 for details on the plots included in the examples.