
For this assignment, you will need two different data sets:
We will use these data sets for later homework assignments. Since scraping the data takes time, save these data sets to use again for the future programs.
The work to be submitted differs by whether you are enrolled in the computer science or mathematics course.
| CMP 464 Homework: | MAT 456 Homework: | |
|---|---|---|
| #1-2 |
Using gradient descent compute the linear regression for the historical Bronx population versus the total New York City population. Display a plot containing the pairs (bx[i],nyc[i]) where bx[i] is the Bronx population in year i and nyc[i] is the total New York city population in year i (Hint: use a scatter plot to show this part). Include on your plot the linear regression line that you computed.
Make sure to include in the title of your plot the date plotted. #1: Submit your Python program as a .py file. #2: Submit a screen shot of the graphics window containing the plot. |
|
| #3-4 |
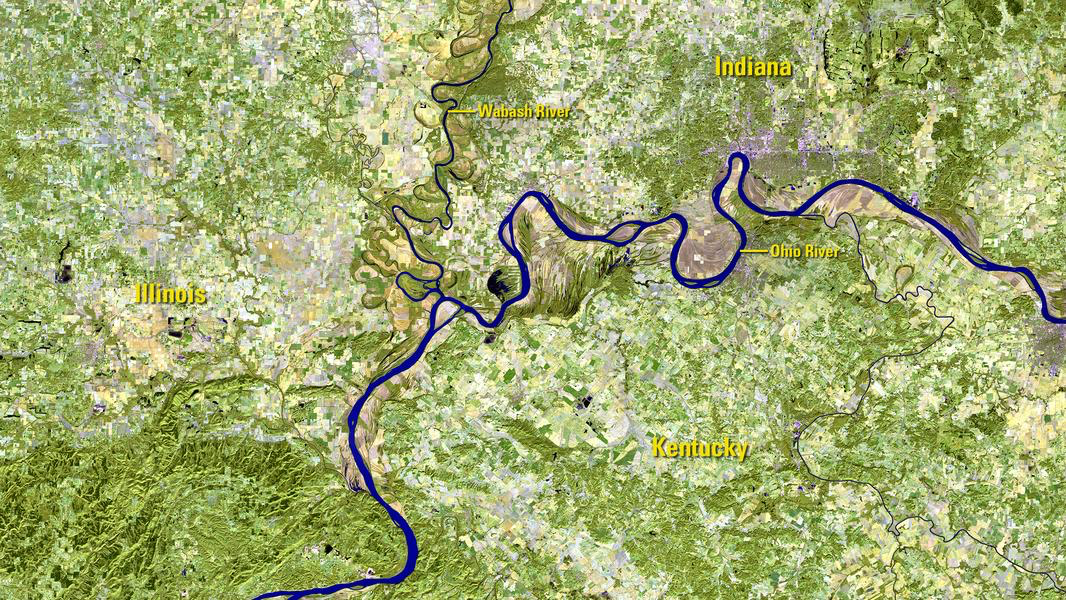
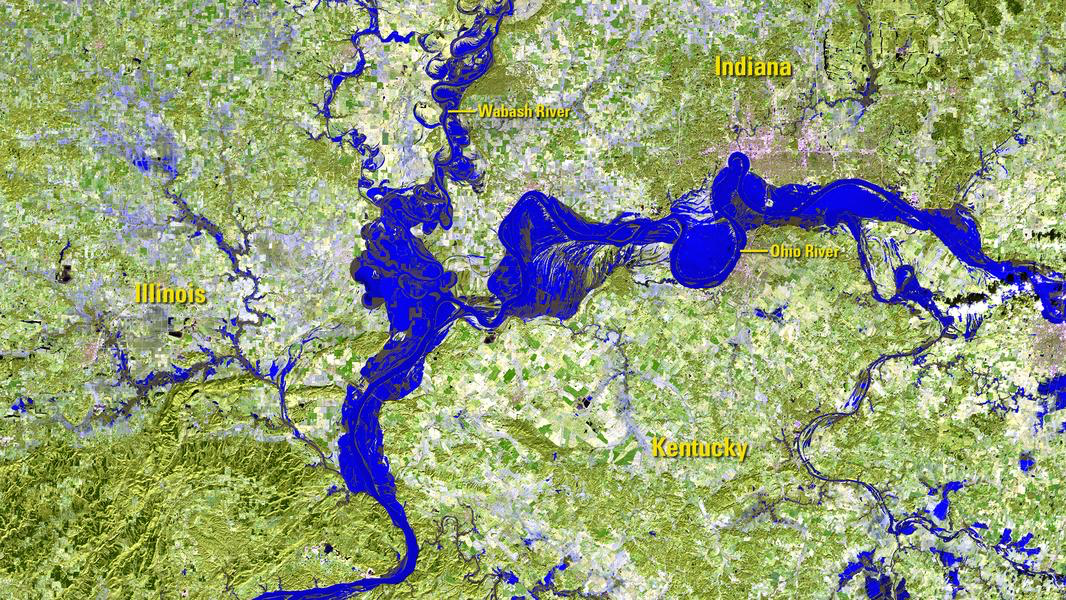
The USGS collected images before and after the
Both: New Year's flooding: New Year's flooding (saved as png for December, 2015 and for January, 2016). Write a program that produces an image with flooded regions marked in red (that is, any pixel that is not "blue" in 2015 but is in the 2016 image).
#3: Submit your Python program as a .py file. #4: Submit a screen shot of the graphics window containing the plot. |
#5-6 |
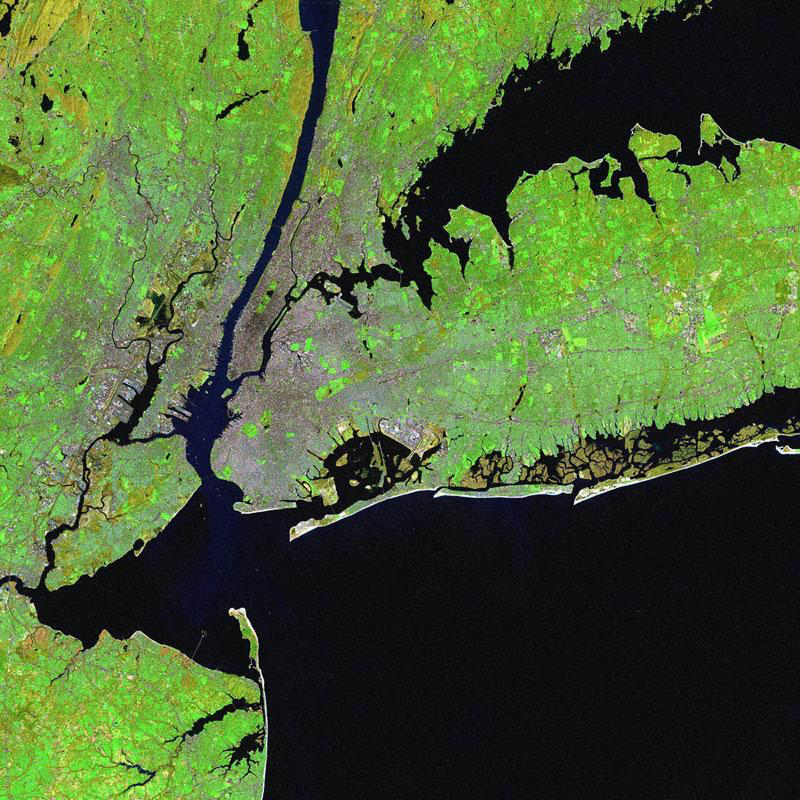
The USGS remote sensing gallery contains an image of
New York City. Filter this image to be a ninth of its original size by saving one pixel out of every 3 x 3 subset.
#5: Submit your Python program as a .py file. #6: Submit a screen shot of the graphics window containing the plot. |
Using gradient descent, find the two local mimima of the function:
f(x,y) = 2*x**2 - 4*x*y + y**4 + 2create a 3D plot of this function and do gradient descent to find the minima. #5: Include a screen shot of a plot of the function, marking the minimum points Hint: See 3dSurface.py example. #6: Include a detailed explanation of the gradient descent approach you used including the gradient of the function, step size, and starting points. |