
For this assignment, the following code from the textbook will be useful:
For this assignment, you will need to download the following data sets:
https://data.ny.gov/Education/City-University-of-New-York-CUNY-University-Campus/i5b5-imzn
We will use these data sets for later homework assignments. Since scraping the data takes time, save these data sets to use again for the future programs.
| CMP 464 Homework: | MAT 456 Homework: | |
|---|---|---|
| #1-2 |
Using the functions from the scipy Voronoi module, create a Voronoi diagram of the CUNY campus locations.
Make sure to include in the title in your plot. #1: Submit your Python program as a .py file. #2: Submit a screen shot of the graphics window containing the plot. |
|
| #3-4 |
In class, we wrote the function
computeNearestNeighbor(fixedPoints, newPoint)where fixedPoints is a list of points and newPoint is a new point, and the function returns the point from the list fixedPoints that is closest to newPoint. Use this function to shade an image based on distance to the nearest point in a list. Your program should:
#3: Submit your Python program as a .py file. #4: Submit .png file that contains your image generated by a run of your program on the points: (100,100), (200,350), (5,395), (375,25), and (200,100). Note your plot might look upside down since on images, (0,0) is the upper left corner. |
|
| #5-7 |
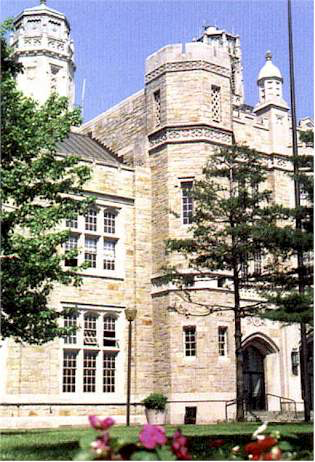
Use the book's clustering.py program to produce images of
Gillet Hall with 5 colors. Modify his program to compute the sum squared error of your clustering to 5 colors (i.e. the sum of the squares of the distance between each point's original color and the color assigned to it).
Make sure to include in the title in your plot. #5: Submit your modified Python program as a .py file. #6: Submit the .png file of the image with 5 colors. #7: Include a screen shot or text file with the summed square error that you computed for the images. Hint: The k-means clustering is slow, so, it will take a while to compute the new images. The book's program includes a method for computing the squared error that reruns the classifer (which takes quite a while). Instead of recomputing, store your clusters and compute the error directly on those. |
|