Session 2, #2: Plotting Cities
We used a coordinate system to plot points to the screen. There is a standard coordinate system for plotting locations on the earth to the screen:
- Longitude gives the east-west position of a location.
- Latitude gives the north-south position of a location.
The origin, (0,0), for this coordinate system lies at a point in the Atlantic Ocean, off the coast of Africa. The axes are:
- the Equator: a east-west line that is halfway between the north and south poles.
- the Prime Meridian: a north-south line that goes through the Royal Observatory in Greenwich, England.
Locations are often described how far east or west and north or south they are of the origin. For example, the location of New York City is 40.7 North and 74.0 West. To plot this, we will use the following convention:
- North: positive numbers for y-value
- South: negative numbers for y-value
- East: positive numbers for x-value
- West: negative numbers for x-value
Using this convention, the coordinates for New York City are (-74.0, 40.7).
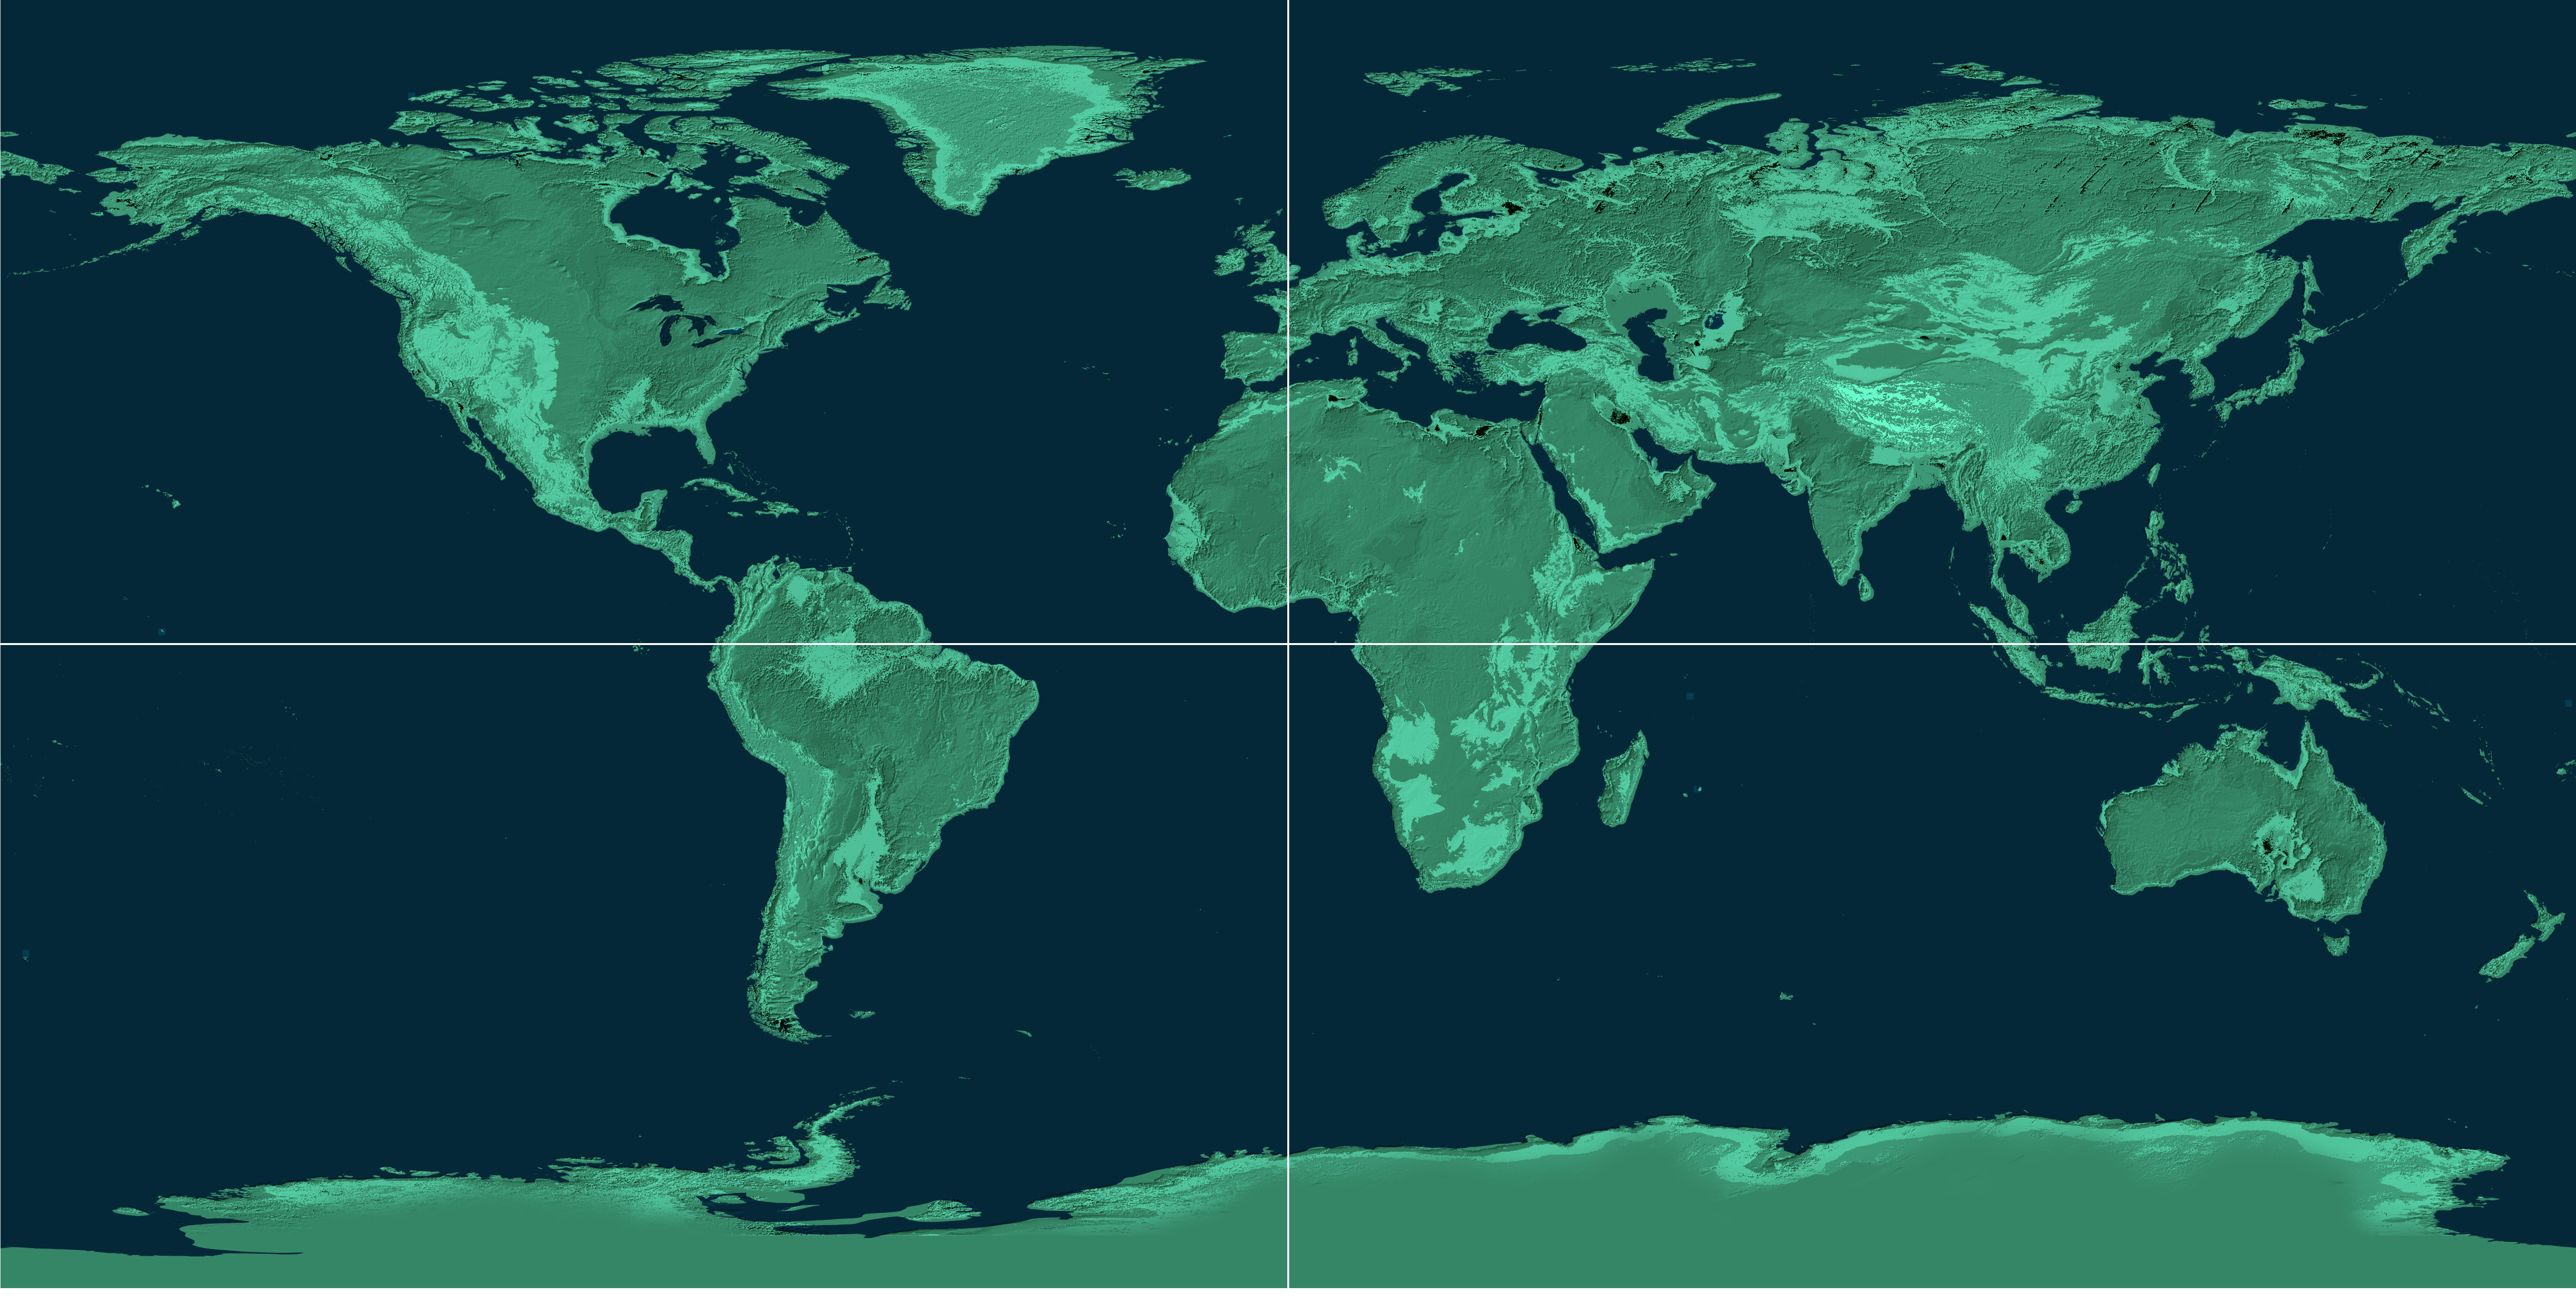
Here's our map as the background of a Python program (if you do not see the full map on your screen, drag the middle gray bar to the left until you do):
The x-values range from -180 to 180; the y-values range from -90 to 90.
Challenge: Run the program and add the code to stamp out the additional cities:
• Los Angeles: (-118, 34),
• Santo Domingo, DR: (-69, 18),
• Tokyo, Japan: 140 degrees east, 35 degrees north,
• Auckland, New Zealand: 174E, 36S, and
• A city that you would like to visit (latlong search tool).