Overview: Coding Quakes
What do earthquake observations tell us about the earth's crust?
This inquiry focuses on mapping data about observed earthquakes to illuminate the fault lines between plates in the structure of the earth's crust. To see these patterns, we need to examine and plot thousands of earthquake observations. This unit is designed as a complementary activity to the Earth Sciences Unit on the Dynamic Earth (NYC Scope & Sequence, ES, Unit 2). It addresses directly the NYC Science Standard 2.2f ("Plates may collide, move apart, or slide past one another. Most volcanic activity and mountain building occur at the boundaries of these plates, often resulting in earthquakes.") as well as NGSS Cross-Cutting Concept on Patterns ("Observed patterns in nature guide organization and classification and prompt questions about relationships and causes underlying them... Empirical evidence is needed to identify patterns.").
While it is possible to plot each earthquake observation with pencil and paper, we will instead develop programs (sets of instructions for the computer to follow) that will take data collected by the United States Geological Survey (USGS) and plot the data onto a map of the earth. We will write our programs in the programming language Python. Python looks a bit like English but has a much stricter format to make it easier for the computer to understand.
To do this, we will break up our task over several sessions:
- plotting points to the screen and storing information in variables,
- plotting GIS data (longitude and latitude of points) to the screen,
- extracting GIS data from the USGS survey data (stored in CSV format),
- using loops to repeat commands, and
- looping through files to plot thousands of earthquakes.
Once we have these core techniques, we can also approach questions about:
- differentiaing points by magnitude (size) of the earthquake by color,
- mapping multiple datasets (such as the location of active volcanos and earthquakes) to the same image, and
- using our programming tools to map other data sets that provide locations (such as FrogsUSA, iBirds).
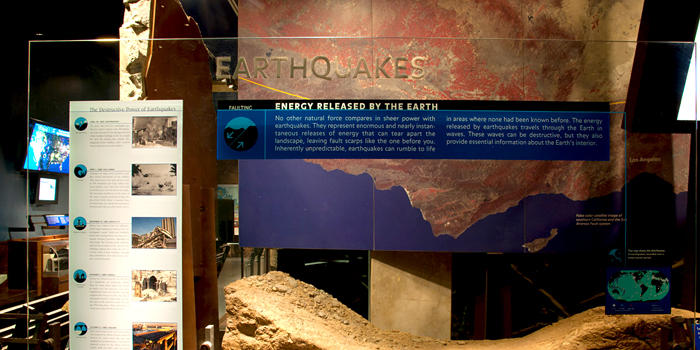
This inquiry has been developed under the auspices of the BridgeUp: STEM program. BridgeUp: STEM is generously supported by a grant from the Helen Gurley Brown Trust. This inquiry was inspired by the exhibit Nature's Fury: The Science of Disasters, which was originally created by The Field Museum, Chicago, with additional content developed by the American Museum of Natural History.