Hunter College OpenData Showcase:
Getting Started
Warm-up: Turtles & GIS Locations
In this section, we will use
Trinkets, an on-line version of Python,
- to get started with Python and its Turtles package,
- to make a world map using latitude and longitude of cities, and
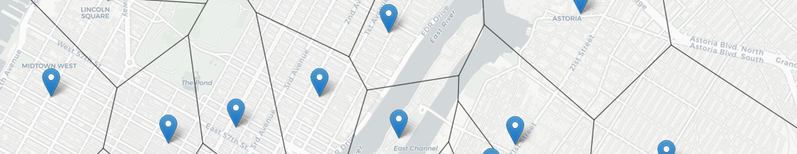
- to make a map of New York City with selected subway stops from NYC OpenData.
Hunter College Laptops
To borrow a laptop for today's workshop, hand a picture ID to undergraduate teaching assistant in exchange for a laptop computer.
The laptops run Ubuntu Linux operating system. When you open the laptop, choose the "Computer Science Guest" account (the password is: 1001E!88). On the left hand side is a bar of icons, including icons for a browser (for accessing webpages) and the terminal window (for writing commands and launching programs).
When you launch the browser, you will see a HunterNet webpage.
- If you are a Hunter student, fill in the form with your Hunter credentials (the same that you would use to access the wifi from your own computer or phone) to access the internet.
- If you are visiting, fill in the form with the username "" and password "".
- If you get a message that you are not connected to the internet, click on the internet symbol (empty quarter circle) in the upper right corner of the toolbar. Hover over the "More Networks" and then click on "HunterNet". The wifi symbol will blink with concentric lines. When it stops blinking and becomes solid lines, an internet connection has been established and you can then reload the webpage to type in the login information.
Turtles
We'll start by drawing shapes with the turtle library of Python. A library is an extra chunk of code, on top of what Python already has in it. Some libraries are built-in to Python, and some are designed by users which you can download separately.
Click the right-facing triange (Run) button to see the program:
The program has several parts:
- It imports the turtle library, so, that its functionality can be used to draw images.
- It sets up a turtle, named taylor, which is purple and turtle shaped.
- It has a loop that repeats the block of indented commands 6 times.
- The commands repeated move taylor forward 100 steps, stamps a turtle shape, and then turns left 60 degrees. These are repeated since they are inside the for-loop.
Challenges:
Try the following:
- Modify the program to make a square.
- Modify the program to make an octagon (8-sided polygon) that is blue.
- Make a red decagon (10-sided polygon) with a triangle stamped on each corner.
Harder: write a program that makes a 5-pointed star.
World Maps
We are going to use Python to make maps. Let's start by mapping cities of the world.
Locations in the world are usually indicated by their longitude and latitude.
- Longitude measures the number of degrees east or west of the prime meridian. When written as a number, it ranges from -180 to +180.
- Latitude measures the number of degrees north or south of the equator. When written as a number, it ranges from -90 (the south pole) to +90 (the north pole).
We will use those ranges to be our coordinates: (-180, -90) to (180,90). Let's map New York City (longitude: -74, latitude: 41):
Challenges:
In the trinket above, stamp the following cities (GIS coordinates are rounded to the nearest whole number):
- Los Angeles (longitude: -118, latitude: 34),
- Paris, France (longitude: 2, latitude:49),
- Tokyo, Japan (longitude: 140, latitude: 35), and
- Rio de Janeiro, Brazil (longitude: -43, latitude: -23).
NYC Maps
The same idea works for mapping at a local scale. Here's a map with Hunter College (longitude: -73.964, latitude: 40.768):
Since we are working with very small differences in numbers, we wrote a separate function to convert the longitude and latitude into numbers large enough for the turtle package to use. To plot a point with our map, we use
teddy.goto(scalePoints(lon,lat))
where
lon and
lat are the GIS coordinates of our points.
Challenges:
In the trinket above, stamp the following locations in different colors:
- Empire State Building (longitude: -73.985664, latitude: 40.748441).
- Grand Central Terminal (longitude: -73.977229, latitude: 40.752726).
- Apollo Theatre (longitude: -73.950056, latitude: 40.810018).
- Lincoln Center (longitude: -73.983489, latitude: 40.772464).
Mapping NYC Library Locations
NYC Open Data stores the GIS coordinates for many datasets. For example, the location of New York City libraries is stored in a format easily read by spreadsheet programs. The "Comma Separated Values" (CSV) files have each column separated by columns. Here's some of the
library CSV
file from
NYC Open Data:
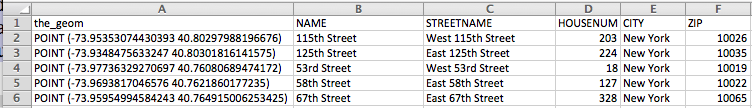
The first column has the longitude and latitude of the library. The next contains the name of the library. Additional columns have more details about the address and location.
Let's use the GIS coordinates from this OpenData file to map the 115th Street Library. It's at (-73.95353074430393, 40.80297988196676). Our trinket maps do not have that precision, so, we can round to: (-73.954, 40.803) and write:
teddy.goto(scalePoints(-73.954, 40.803))
Challenges
Stamp the locations of
- 125th Street Library,
- 53rd Street Library, and
- 58th Street Library
onto a map of New York City. The GIS coordinates are in the above image of the CSV file.
What's Next?
Next, we'll explore ways to have Python work through the OpenData files with a fabulous package called
Pandas (see
Using Structured Data).