Folium is a Python package that uses the javascript Leaflet.js library to make beautiful interactive maps. Instead of popping up a matplotlib window, folium creates an .html file that you can open (and view interactively) with a browser. After the program runs, open the corresponding html file in a web browser to see your map.
(Folium is installed on the Hunter machines, To check to see if your home machine has it, type at the Python prompt:
import folium
If you get an error, go to the terminal, and download it:
pip install foliumand the package will download and install.)
To make a map in folium, the process is:
Here's our first program:
#Import the folium package for making maps
import folium

#Create a map, centered (0,0), and zoomed out a bit:
mapWorld = folium.Map(location=[0, 0],zoom_start=3)

#Save the map:
mapWorld.save(outfile='tempMap.html')
Save this file and run it. It will create a file called tempMap.html. Open your favorite browser (Chrome, Firefox, IE, etc.) and choose "Open File" and then choose the file tempMap.html. You should see a map of the world.
Let's make another map, focused on New York City. To do that, when we set up the map object, we need to reset the location to New York City and the increase the zoom level:
import folium

mapCUNY = folium.Map(location=[40.75, -74.125], zoom_start=10)
Let's add in a marker for Hunter College:
folium.Marker(location = [40.768731, -73.964915], popup = "Hunter College").add_to(mapCUNY)
and create the .html file:
mapCUNY.save(outfile='nycMap.html')Save your commands to a file and run via IDLE. Your program will create an .html file called, nycMap.html. Open it in your favorite browser to make sure it creates a map of NYC with a marker for Hunter College.
Let's make an interactive map of the WiFi locations across the city. We can use wifiLocations.csv or download a CSV file from NYC OpenData:
(Export as a .csv file and save in the same directory as your programs, as wifiLocations.csv). Open the file to make sure you have all the lines and to check if the column headings occur in the first row (they do, so no need to skip rows when reading in the file).Let's use Pandas to read in the file. We will need to import pandas and folium:
import folium
import pandas as pd
To read in the CSV file, we'll use pandas' CSV reader. We'll print out the campus locations to make sure that all were read in:
wifi = pd.read_csv('wifiLocations.csv')
print (wifi["Location"])
Note: we saved our CSV file to 'wifiLocations.csv'. If you saved it to a different name, change the input parameters for read_csv() to the name of your file.
Next, let's set up a map, centered on Hunter College:
mapWIFI = folium.Map(location=[40.768731, -73.964915])
We need to add markers for each campus. We're going to iterate through the rows of dataframe to create the markers:
for index,row in cuny.iterrows():
    lat = row["Latitude"]
    lon = row["Longitude"]
    name = row["Location"]
    newMarker = folium.Marker([lat, lon], popup=name)
    newMarker.add_to(mapWIFI)
For each row in the file, we find the latitude, longitude, and name of the campus, and use those to create a new marker which we add to our map. We repeat for each row, until we have made markers for all 23 campuses in the file.
Lastly, let's save our map:
mapWIFI.save(outfile='wifiLocations.html')
To view your map, open a browser. From the browser, open the file: wifiLocations.html.
Many of the datasets in NYC OpenData have similar structure. For example, the 311 calls recorded by the city also store the GIS location as "Latitude" and "Longitude". So, our program above can be used, with minimal modification, to make a map of recent 311 calls.
We have downloaded a small subset of the 311 calls in test311.csv (200 calls from March 5, 2018).
NYC OpenData also has the data for all collisions reported to the police:
https://data.cityofnewyork.us/Public-Safety/NYPD-Motor-Vehicle-Collisions/h9gi-nx95.Since the files are quite large, use the "Filter" option and choose your favorite date in 2017 and "Export" (in CSV format) all collisions for that day.
A sample run for New Years Day in 2016 is:
Enter CSV file name:  collisionsNewYears2016.csv
Top three contributing factors for collisions:
Driver Inattention/Distraction    136
Unspecified                       119
Following Too Closely              37
Name: CONTRIBUTING FACTOR VEHICLE 1, dtype: int64
Hint: For this data set, the names of the columns are "LATITUDE" and "LONGITUDE" (unlike the previous map problem, where the data was stored with "Latitude" and "Longitude").
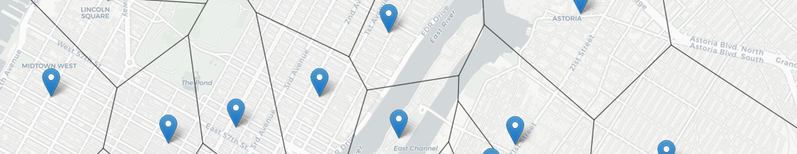
(The map above is for March 18, 2016 using the time the collision occurred ("TIME") to label each marker and changed the underlying map with the option: tiles="Cartodb Positron" when creating the map. When creating datasets to test your program, you will need to filter for both date (to keep the files from being huge) and that there's a location entered. The former is explained above; to check the latter, add the additional filter condition of "LONGITUDE is not blank". )
Sponsored by the Hunter College Department of Computer Science, Undergraduate Admissions, & Hunter Women in Computer Science.