Program 4: Restaurant Cleaning
CSci 39542: Introduction to Data Science
Department of Computer Science
Hunter College, City University of New York
Spring 2022
Classwork Quizzes Homework Project
Program Description
Program 4: Restaurant Cleaning. Due noon, Thursday, 3 March.
This program continues with the Restaurant Inspection Data Set, and uses regular expressions (covered in Lecture 7 & DS 100: Sections 13.2-3) to clean restaurant inspection datasets for later use.
The assignment is broken into the following functions to allow for unit testing:
For example, if the file was restaurants30July.csv with the first 3 lines of:
We can apply the next three functions to clean up the data:
The next function computes the time between the inspection and the grade being reported:
Looking at a larger data set (inspections of Coffee/Tea establishments in 2021), we can see what are the most common day for inspections, by boroughs:
Learning Objective: to use regular expressions (pattern matching) with simple patterns to filter data from files.
Available Libraries: Regular expressions (re), timedate, pandas, and core Python 3.6+.
Data Sources: Restaurant Inspection Data from OpenData NYC.
Sample Datasets: restaurants30July.csv, inspections of Coffee/Tea establishments in 2021.
make_insp_df(file_name):
This function takes one input:
The function should open the file file_name: the name of a CSV file containing Restaurant Inspection Data from OpenData NYC.
file_name as DataFrame, keeping only the columns:
If the 'CAMIS', 'DBA', 'BORO', 'PHONE', 'CUISINE DESCRIPTION', 'INSPECTION DATE', 'RECORD DATE', 'GRADE'GRADE is null for a row, that row should be dropped. The resulting DataFrame is returned.
clean_phone(phone_str):
This function takes one input:
If date_str: a string containing a phone number.
date_str is a 10 digit number, NNNNNNNNNN, return the number formatted with parenthesis and dashes: (NNN)-NNN-NNNN. If date_str does not contain a 10 digit number, return None.
convert_dates(df):
This function takes one input:
The function converts the columns, the columns df: a DataFrame containing the columns INSPECTION DATE and RECORD DATE.
INSPECTION DATE and RECORD DATE which are read in as strings to datetime object (hint: you may need to use a format string when converting) and returns the resulting DataFrame.
insp_day_of_week(insp):
This function takes one input:
The function should then return the number corresponding to the day of the week of the inspection: 0 for Monday, 1 for Tuesday, ... 6 for Sunday. If the date is January 1, 1900, then the establishment has not yet had an inspection, and your function should return insp: a datetime object.
None.
days_since(insp_date, record_date):
This function takes two input:
If insp_date: a datetime object.
record_date_str: a datetime object.
insp_date is January 1, 1900, then the establishment has not yet had an inspection, and your function should return None.
If either input is None, you should return None.
Otherwise, return an integer representing the number of days between insp_date and record_date.
group_df(df,categories=['INSP DAY','BORO']):
This function takes two inputs:
This function groups by the categories (using df: a DataFrame containing the columns categories.
categories: a list of column names in df.
.size() to aggregate) and returns the result as a DataFrame (i.e. applies .to_frame() before returning).
Then a sample run of the program:
CAMIS,DBA,BORO,BUILDING,STREET,ZIPCODE,PHONE,CUISINE DESCRIPTION,INSPECTION DATE,ACTION,VIOLATION CODE,VIOLATION DESCRIPTION,CRITICAL FLAG,SCORE,GRADE,GRADE DATE,RECORD DATE,INSPECTION TYPE,Latitude,Longitude,Community Board,Council District,Census Tract,BIN,BBL,NTA
41178124,CAFE 57,Manhattan,300,WEST   57 STREET,10019,2126492729,American,7/30/2021,Violations were cited in the following area(s).,09C,Food contact surface not properly maintained.,Not Critical,4,A,7/30/2021,8/1/2021,Cycle Inspection / Initial Inspection,40.76643902,-73.98332508,104,3,13900,1025451,1010477502,MN15
50111450,CASTLE CHICKEN,Bronx,5987A,BROADWAY,10471,9178562047,Chicken,7/30/2021,Violations were cited in the following area(s).,05D,Hand washing facility not provided in or near food preparation area and toilet room. Hot and cold running water at adequate pressure to enable cleanliness of employees not provided at facility. Soap and an acceptable hand-drying device not provided.,Critical,41,N,,8/1/2021,Pre-permit (Operational) / Initial Inspection,40.88993027,-73.89805316,208,11,28500,2084208,2058011033,BX29
40699339,NICK GARDEN COFFEE SHOP,Bronx,2953,WEBSTER AVENUE,10458,7183652277,Coffee/Tea,7/30/2021,Violations were cited in the following area(s).,08A,Facility not vermin proof. Harborage or conditions conducive to attracting vermin to the premises and/or allowing vermin to exist.,Not Critical,31,,,8/1/2021,Cycle Inspection / Initial Inspection,40.86759042,-73.88308647,207,11,41500,2016446,2032800061,BX05
And the first lines would be:
df = p4.make_insp_df('restaurants30July.csv')
print(df.head())
Note that we printed the indices, and some of the initial rows were dropped due to null values.
      CAMIS              DBA       BORO  ... INSPECTION DATE RECORD DATE GRADE
0  41178124          CAFE 57  Manhattan  ...       7/30/2021    8/1/2021     A
1  50111450   CASTLE CHICKEN      Bronx  ...       7/30/2021    8/1/2021     N
3  41181395          DUNKIN'   Brooklyn  ...       7/30/2021    8/1/2021     A
5  50104136  FLATBUSH  BAGEL   Brooklyn  ...       7/30/2021    8/1/2021     N
6  50106274        BURGER IM   Brooklyn  ...       7/30/2021    8/1/2021     A

[5 rows x 8 columns]
And the first lines of those columns would be:
df = df.assign( PHONE = df['PHONE'].apply(p4.clean_phone) )
df = p4.convert_dates(df)
df['INSP DAY'] = df['INSPECTION DATE'].apply(p4.insp_day_of_week)
print(df[ ['PHONE','INSPECTION DATE','RECORD DATE','INSP DAY'] ].head()) PHONE INSPECTION DATE RECORD DATE INSP DAY
0 (212)-649-2729 2021-07-30 2021-08-01 4
1 (917)-856-2047 2021-07-30 2021-08-01 4
3 (718)-627-2450 2021-07-30 2021-08-01 4
5 (516)-491-5588 2021-07-30 2021-08-01 4
6 (718)-673-6066 2021-07-30 2021-08-01 4
For current restaurant inspection data, if the restaurant passes, a grade is reported on the same day as the inspection:
df['RECORD TIME'] = df.apply(lambda row: p4.days_since(row['INSPECTION DATE'], row['RECORD DATE']),axis=1)
print(df[ ['INSPECTION DATE','RECORD DATE','RECORD TIME'] ].head()) INSPECTION DATE RECORD DATE RECORD TIME
0 2021-07-30 2021-08-01 2
1 2021-07-30 2021-08-01 2
3 2021-07-30 2021-08-01 2
5 2021-07-30 2021-08-01 2
6 2021-07-30 2021-08-01 2
Prints out:
df_day_boro = p4.group_df(df)
print(df_day_boro)
Using DS 100 Chapter 11 and matplotlib.pyplot documentation for customizing plots yields:
INSP DAY BORO
0        Bronx            2
   Brooklyn        56
   Manhattan       81
   Queens          52
   Staten Island    3
1        Bronx            4
   Brooklyn       113
   Manhattan      131
   Queens          37
2        Bronx           20
   Brooklyn        88
   Manhattan      121
   Queens          36
   Staten Island   13
3        Bronx            5
   Brooklyn        77
   Manhattan      130
   Queens          25
4        Bronx            9
   Brooklyn        55
   Manhattan       73
   Queens          48
   Staten Island    2
5        Brooklyn         7
   Queens           4
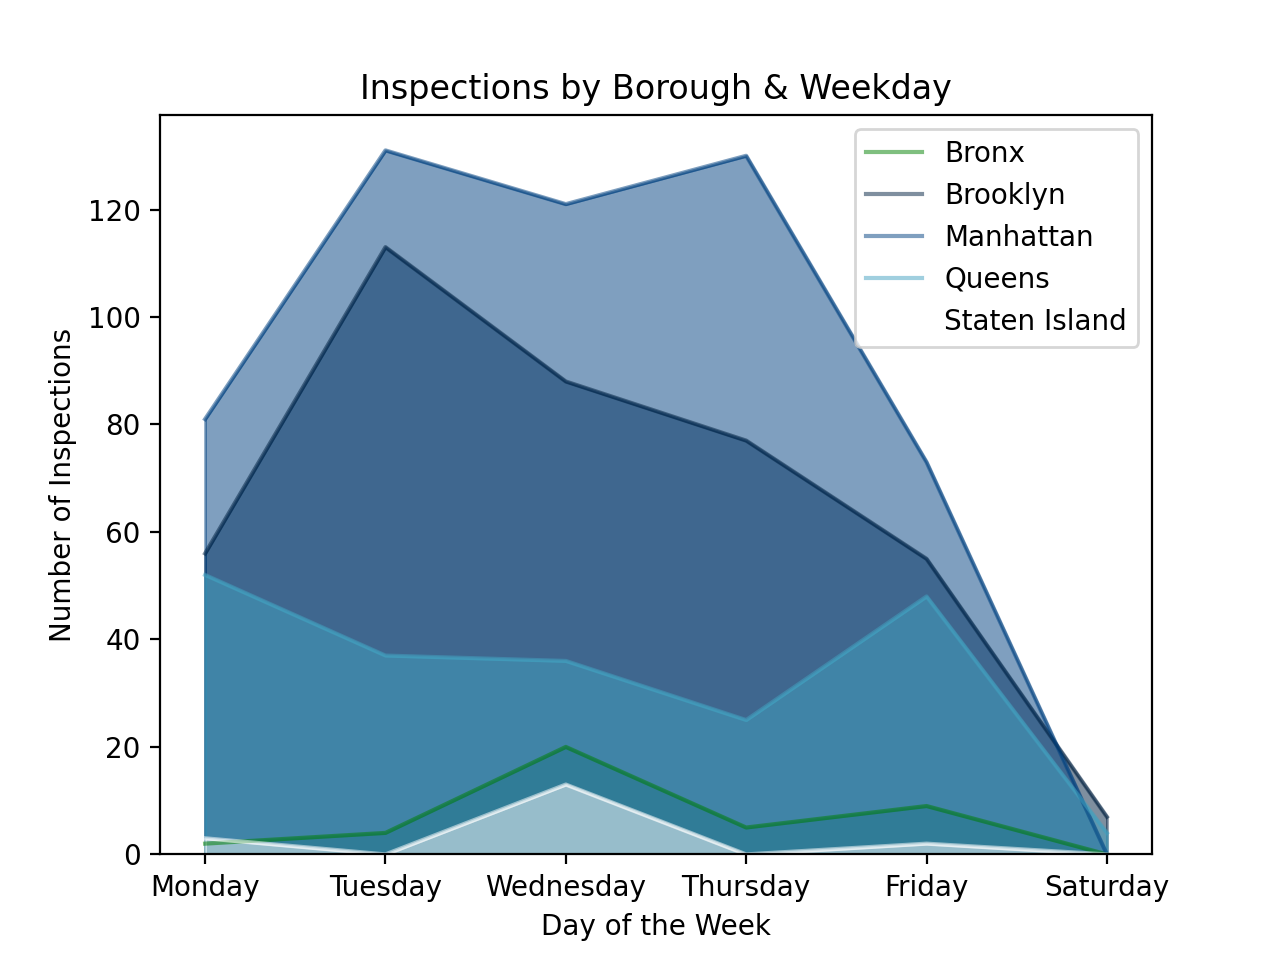
The code to generate this is:
import seaborn as sns
import matplotlib.pyplot as plt
df_day_boro.unstack().plot.area(stacked=False,colormap='ocean')
plt.title('Inspections by Borough & Weekday')
plt.xlabel('Day of the Week')
plt.ylabel('Number of Inspections')
plt.xticks([0,1,2,3,4,5],['Monday','Tuesday','Wednesday','Thursday','Friday','Saturday'])
plt.legend(labels=['Bronx','Brooklyn','Manhattan','Queens','Staten Island'])
plt.show()- See Lecture 6 or DS 100: Section 9.4 for working with dates and times. Additional information on
strptime(date_string, format)can be found at Python Docs, datetime. - See DS 100: Chapter 11 for details on the plots included in the examples.